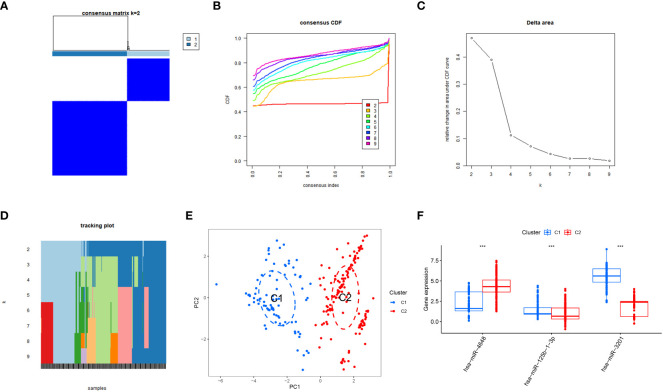
Figure 6.
Subtype classification based on PCRSMs. (A) Heatmap representing the consensus matrix for K=2, illustrating the clustering patterns. (B) Cumulative distribution function of the consensus values for K=2-9, providing insights into the optimal number of subtypes. (C) Evaluation of the relative change in the area under the curve (AUC) of the cumulative distribution function. (D) Final classification results of the samples for K=2-9, indicating the assigned subtypes. (E) Principal Component Analysis (PCA) plot demonstrating the effective segregation of pancreatic cancer patients into two distinct subtypes using PCRSMs. (F) Box plots illustrating the differential expression patterns of the PCRSMs between the two identified subtypes. ***, p<0.001

