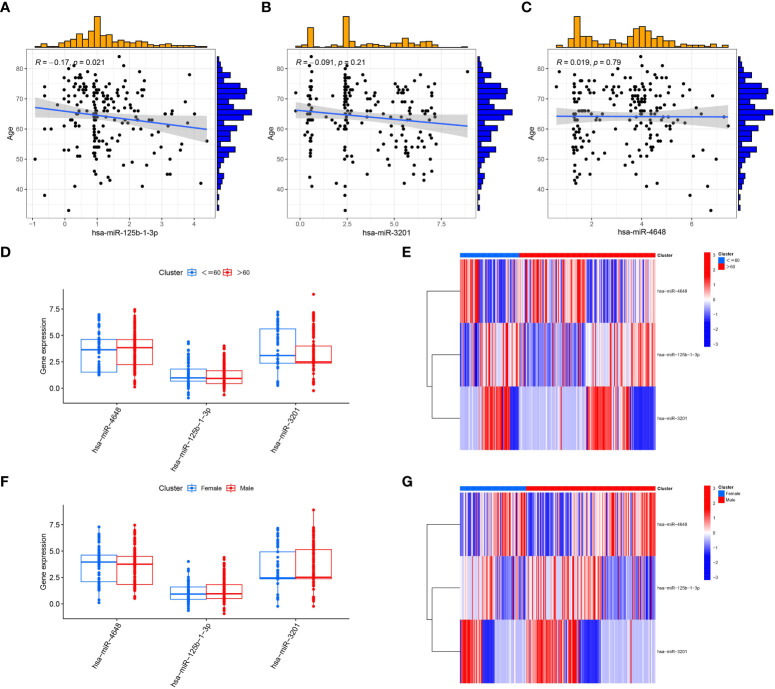
Figure 7.
Correlation analysis between PCRSMs and clinical characteristics of pancreatic cancer patients. (A–C) Correlation analysis between the expression levels of three PCRSMs and age, with R>0 indicating positive correlation and R<0 indicating negative correlation, and P<0.05 indicating statistical significance. (D, E) Box plots and heatmaps showing the expression of PCRSMs in two groups divided by 60 years of age. (F, G) Box plots and heatmaps showing the gender differences in the expression of PCRSMs.

