
Figure 1.
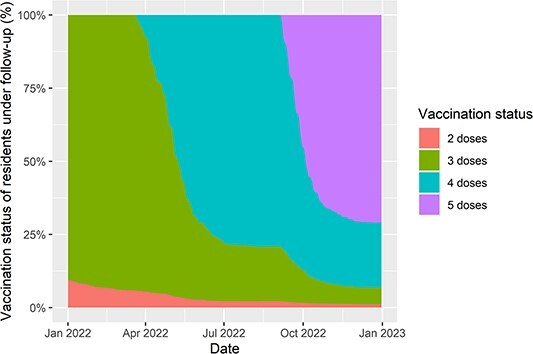
Plot of booster vaccination status of residents of long-term care facilities included in the analysis. The percentage of residents with each number of vaccine doses is given amongst those in follow-up for the analysis at any given point in time.