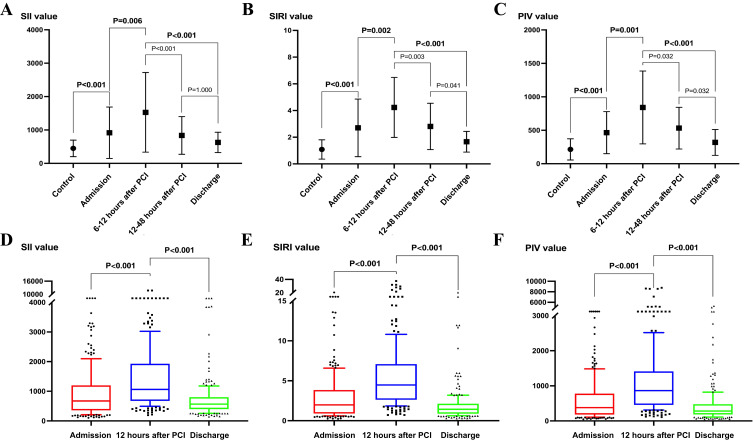
Figure 3.
Trajectory of the dynamic changes of inflammatory markers SII, SIRI, and PIV from admission to discharge in patients with ST-segment elevation myocardial infarction. Trajectory of SII (A), SIRI (B), and PIV (C) dynamics in 42 patients with ST-segment elevation myocardial infarction (Mann–Whitney U-test P < 0.05, Friedman test and Bonferroni post hoc test adjusted P < 0.05). Box-and-whisker plot showing dynamic change trends for SII (D), SIRI (E), and PIV(F) in 216 patients with ST-segment elevation myocardial infarction (Friedman test and Bonferroni post hoc test adjusted P < 0.05). Boxes indicate 25–75% interquartile range; horizontal lines in boxes, median width; whiskers, 10–90% range; dots, detected outliers that reside outside the whisker range. Bolded values indicate higher levels of inflammatory markers SII, SIRI, and PIV in patients with STEMI at admission compared to the non acute myocardial infarction (control group). In patients with STEMI, the expression levels of inflammatory markers SII, SIRI, and PIV were higher 6–12 or 12 hours after PCI compared to admission and discharge.
Abbreviations: SII, systemic immune-inflammation index; SIRI, systemic inflammation response index; PIV, pan-immune-inflammation value, PCI, percutaneous coronary intervention.

