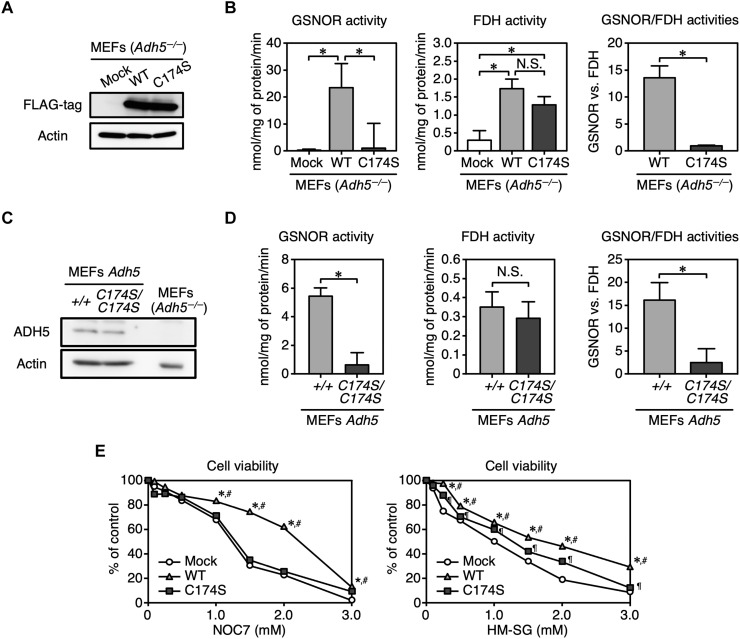
Fig. 7. Characterization of ADH5 C174S in mammalian cells.
(A) Immunoblot analysis to detect FLAG-tagged WT ADH5 and C174S mutant ADH5 that were transiently expressed in Adh5−/− MEFs. (B) Measurement of GSNOR (left) and FDH (middle) activities in lysates of Adh5−/− MEFs expressing WT ADH5 or C174S mutant ADH5. Right: The ratio of GSNOR activities to FDH activities for each ADH5 protein expressed in Adh5−/− MEFs. Data are means ± SD (n = 3). *P < 0.001, one-way ANOVA with Tukey’s multiple comparisons test. N.S., not significant. (C) Immunoblot analysis of WT and mutant ADH5 proteins expressed in Adh5+/+ and Adh5C174S/C174S MEFs. (D) Measurement of GSNOR (left) and FDH (middle) activities in lysates of Adh5+/+ and Adh5C174S/C174S MEFs. Right: The ratio of GSNOR activities to FDH activities for each sample. Data are means ± SD, n = 3. *P < 0.001, unpaired Student’s t test. (E) Viability of MEFs after NOC7 or HM-SG treatment. Data are means ± SD, n = 4. *P < 0.001 versus Mock Adh5−/−, #P < 0.001 versus Adh5−/−-expressing C174S mutant, ¶P < 0.01 versus Mock Adh5−/−, two-way ANOVA with Tukey’s multiple comparisons test.

