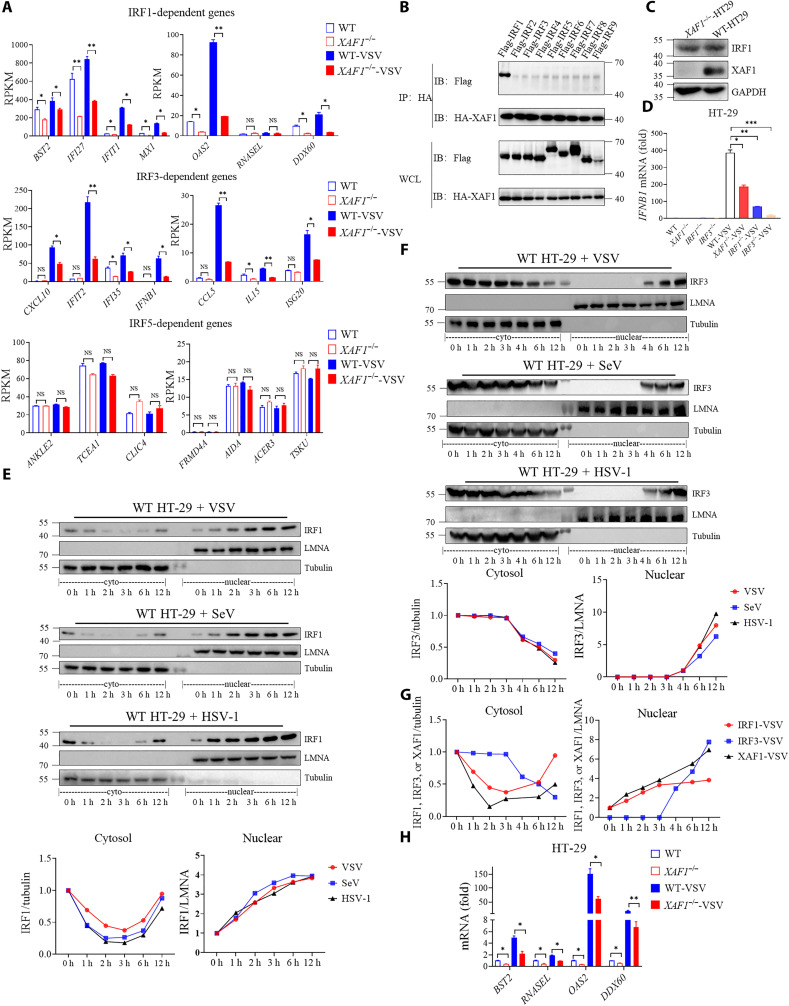
Fig. 5. XAF1 is required for induction of IRF1- and IRF3- target genes.
(A) Analysis of IRF1-, IRF3-, and IRF5-regulated gene expression levels in WT and XAF1−/− HT-29 cells from RNA-seq data. (B) coIP assay analysis of the interaction between XAF1 and IRF1, IRF2, IRF3, IRF4, IRF5, IRF6, IRF7, IRF8, and IRF9. (C) Western blot showed protein level of endogenous IRF1 in WT and XAF1−/− HT-29 cells. (D) qRT-PCR analysis of IFNB1 after NT or after stimulation with VSV for 12 hours in WT, XAF1−/−, IRF1−/−, and IRF3−/− HT-29 cells. (E and F) Cytoplasmic and nuclear fractions were isolated, and then, the time course of changes in (E) IRF1 levels and (F) IRF3 levels in each fraction after VSV, SeV, and HSV-1 infection in HT-29 cells was tracked by Western blotting analysis. The relative expression of IRF1 and IRF3 (relative to GAPDH or LMNA) curve shows its dynamic changes in the cytoplasm and nucleus. (G) Relative expression of XAF1, IRF1 and IRF3 (relative to GAPDH or LMNA) curve shows its dynamic changes in the cytoplasm and nucleus after VSV infection in HT-29 cells. (H) qRT-PCR analysis of BST2, RNASEL, OAS2, and DDX60 after NT or after stimulation with VSV for 12 hours in WT and XAF1−/− HT-29 cells. Data are means ± SEM (n = 3) from three independent experiments. *P < 0.05 and **P < 0.01, and ***P < 0.001 [Student’s t test (A), (D), and (H)]. Data are representative of two (A) or three [(B) to (H)] independent experiments with similar results. RPKM, reads per kilobase per million mapped reads; HA, hemagglutinin.

