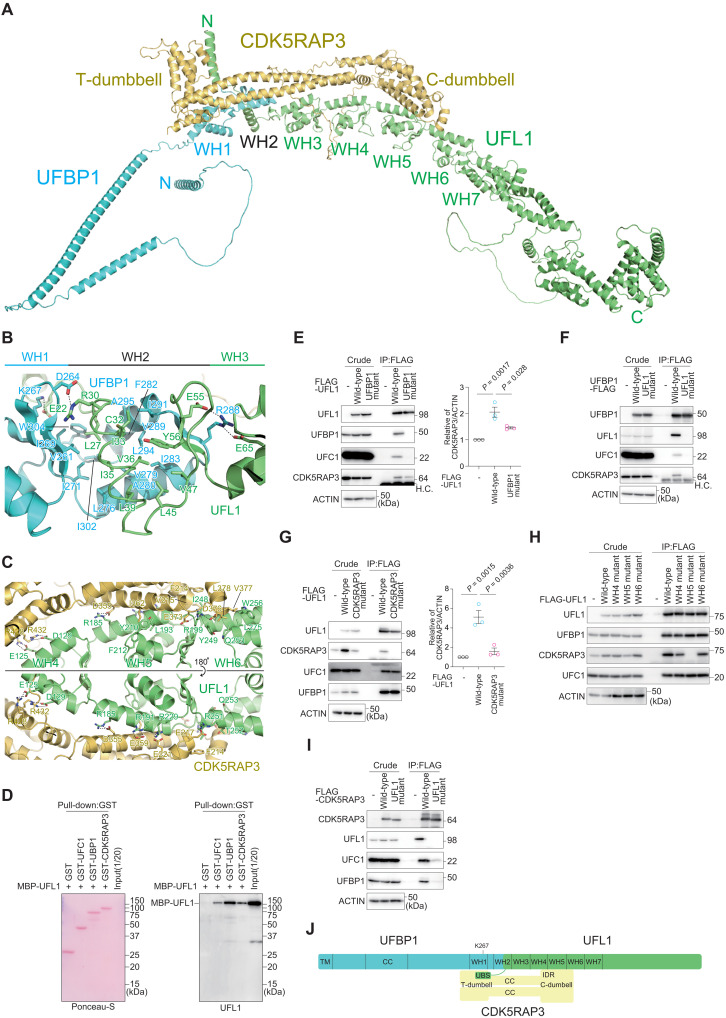
Fig. 1. Structure and interaction modes of the UFM1 E3 complex.
(A) Predicted three-dimensional structure of the full-length UFL1-UFBP1-CDK5RAP3 E3 complex. (B and C) Predicted recognition mode of UFL1 by UFBP1 (B) and by CDK5RAP3 (C). The side chains involved in the interactions are shown with a stick model, where oxygen and nitrogen atoms are colored red and blue, respectively. Broken lines indicate possible salt bridges. (D) Direct interaction of UFL1 with UFC1, UFBP1, and CDK5RAP3. Glutathione S-transferase (GST), GST-UFC1, GST-UFBP1, or GST-CDK5RAP3 was immobilized on glutathione Sepharose column. The Sepharose and recombinant MBP-UFL1 were incubated, and the pulled-down products were then subjected to SDS–polyacrylamide gel electrophoresis (SDS-PAGE) followed by immunoblotting with anti-UFL1 antibody. Data shown are representative of three separate experiments. (E to I) Biochemical characterization of the binding among the E3 components. (E) FLAG-tagged wild-type UFL1 and UFBP1 interaction–defective UFL1 mutant (UFL1UFBP1 mutant) were transfected into UFL1-deficient HEK293T cells. (F) FLAG-tagged wild-type UFBP1 and UFL1 interaction–defective UFBP1 (UFBP1UFL1 mutant) were transfected into UFBP1-deficient HEK293T cells. H.C. indicates IgG heavy chain. (G) FLAG-tagged wild-type UFL1 and CDK5RAP3 interaction–defective UFL1 mutant (UFL1CDK5RAP3 mutant) were transfected into UFL1-deficient HEK293T cells. (H) FLAG-tagged wild-type UFL1 and UFL1 mutants harboring different WH domains (UFL1WH4, UFL1WH5, and UFL1WH6 mutant) were transfected into UFL1-deficient HEK293T cells. (I) FLAG-tagged wild-type CDK5RAP3 and UFL1-interaction defective CDK5RAP3 (CDK5RAP3UFL1 mutant) were transfected into CDK5RAP3-deficient HEK293T cells. Forty-eight hours after transfection, cells were lysed and immunoprecipitated with anti–FLAG-M2 gel; then, the immunoprecipitants were subjected to immunoblot analysis with the indicated antibodies. Bar graph shows the results of quantitative densitometric analysis of CDK5RAP3 relative to actin (n = 3). Data are means ± SE. Statistical analysis was performed by Welch’s t test. Data shown are representative of three separate experiments. (J) Schematic binding model of the UFM1 E3 complex. TM, transmembrane helix; CC, coiled-coil; WH, winged helix; UBS, UFC1-binding sequence.

