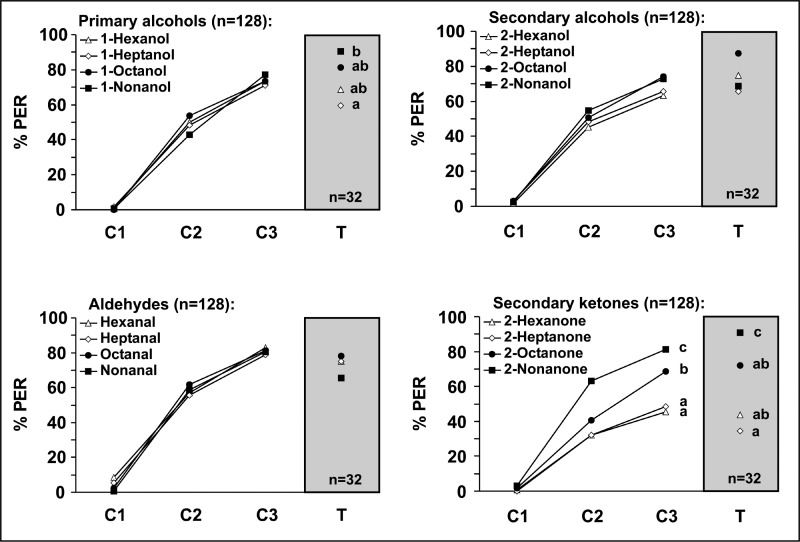
Figure 1. Acquisition Curves for Primary Alcohols, Secondary Alcohols, Aldehydes, and Ketones.
The ordinate represents the percentage of proboscis extensions to the training odour (CS). The abscissa indicates the conditioning trials (C1, C2, C3) and the test with the CS (T). The curves correspond to molecules with 6 (white triangles), 7 (white diamonds), 8 (black circles) and 9 carbons (black squares); (n = 128 bees for each curve). As not all 128 bees were tested with the odour used as CS, the sample size in the tests was smaller (n = 32). Different letters (a, b, c) indicate significant differences either between acquisition curves for different chain-length molecules (in the case of the ketones) or between test responses (post hoc Scheffé tests).

