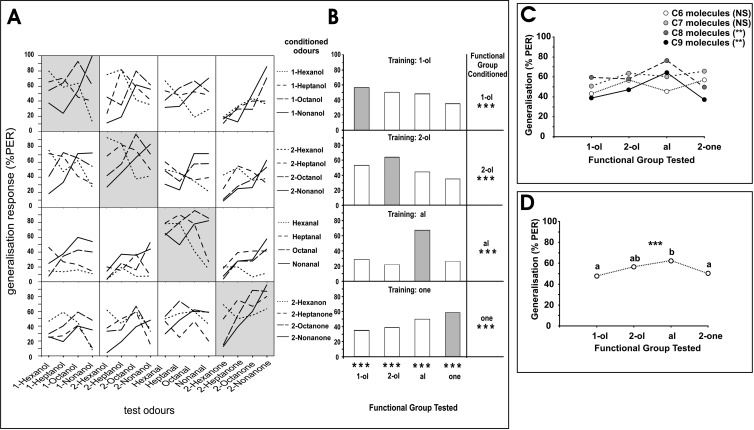
Figure 3. Generalisation Depending on Functional Groups.
(A) Data of the generalisation matrix (see Figure 2) represented as two-dimensional graphs for each conditioned odour. The right ordinate represents the CSs categorised in four functional groups, primary alcohols, secondary alcohols, aldehydes, and ketones (from top to bottom). The abscissa represents the test odours aligned in the same order as the conditioned odours (from left to right). The left ordinate represents the percentage of proboscis extensions to the test odours after being trained to a given odour. Each quadrant in the figure represents generalisation responses to one functional group after training for the same (grey quadrants) or to a different functional group (white quadrants).
(B) Same data as in (A), but the observed responses within each quadrant were pooled and the resulting percentage of responses per quadrant was calculated. The abscissa and the right ordinate represent the four functional groups. The left ordinate represents the percentage of proboscis extensions to each of these groups after being trained to a given group. Grey bars correspond to grey quadrants in (A) and represent generalisation to the same functional group as the conditioned one. White bars correspond to white quadrants in (A) and represent generalisation to a functional group different from the conditioned one: 1-ol, 2-ol, al, and one mean primary alcohol, secondary alcohol, aldehyde, and ketone, respectively. Asterisks indicate significant differences along a row or a column (p < 0.001)
(C) Within-functional group generalisation, depending on chain length. The abscissa represents the functional groups tested. The ordinate represents the percentage of proboscis extensions to the functional groups tested after being trained to a given chain-length (lines). Thus, for instance, the first point to the left for C9 molecules (black circles) represents generalisation to 1-hexanol, 1-heptanol, and 1-octanol after conditioning to 1-nonanol. A significant heterogeneity was found in within-functional group generalisation for C8 and C9 but not for C6 and C7 molecules.
(D) Generalisation within-functional groups. The figure shows results from pooling the data of (C) corresponding to each functional group. Each point shows the percentage of proboscis extensions to odours of the same functional group as the conditioned odour. Within-group generalisation was significantly heterogeneous (asterisks, p < 0.001). Pairwise comparisons showed that generalisation within aldehydes was significantly higher than within primary alcohols or ketones and marginally higher than within secondary alcohols (different letters indicate significant differences).

