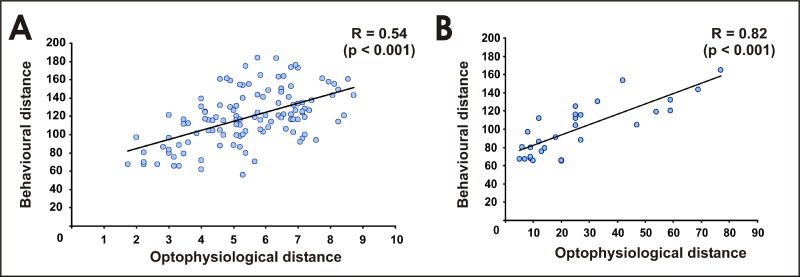
Figure 7. Correspondence between Perceptual and Physiological Odour Similarity.
(A) Correlation between optophysiological measures of odour similarity (carried out using calcium imaging recordings [23]) and our behavioural measures of odour similarity. Euclidian distance between odour representations in our 16-dimension “behavioural” space for all odour pairs (120 pairs, x axes) and distances between odours in optical imaging experiments, using the odour category maps displayed by Sachse et al. [23] (also 120 pairs, y axes) were calculated. This correlation, including all 120 odour pairs, was highly significant (r = 0.54, p < 0.001). Odours found to be similar in the optical imaging study were also similar in the behaviour. Data points cluster quite broadly around the main trend line, showing that many exceptions were found.
(B) Correlation between measures of optophysiological similarity carried out using the optical imaging technique [23] and our behavioural measure of odour similarity. Using the exact data given for primary and secondary alcohols [23], a much better correlation between the two datasets was achieved than in (A) (r = 0.82, p < 0.001), although outliers were still found in the data.

