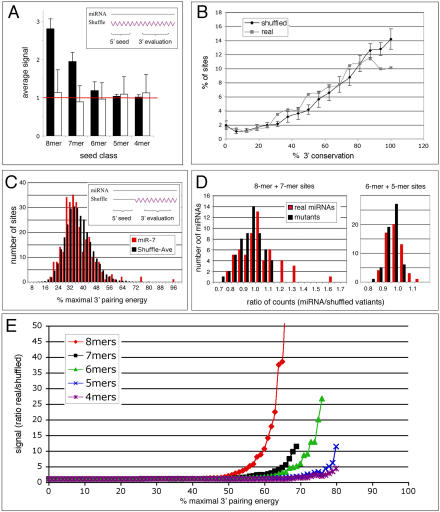
Figure 6. Computational Analysis of Target Site Occurrence.
(A) Genome-wide occurrence of conserved 5′ seed matches. Histogram showing the ratio of 5′ seed matches for a set of 49 5′ non-redundant miRNAs and the average of their ten completely shuffled variants for different seed types (black bars). A ratio of one (red line) indicates no difference between the miRNA and its shuffled variants. The same ratio for mutated miRNAs and their shuffled variants shows no signal (white bars). The inset depicts shuffling of the entire miRNA sequence (wavy purple line).
(B) Target site conservation between D. melanogaster and D. pseudoobscura. Histogram showing the average conservation of the 3′ UTR sequence (16 nt) upstream of a conserved 8mer seed match that would pair to the miRNA 3′ end. All sites were binned according to their conservation, and the percentage of sites in each bin is shown for sites identified by 49 5′ non-redundant miRNA sequences (grey) and their shuffled control sequences (black, error bars indicate one standard deviation).
(C) 3′ pairing preferences for miR-7 target sites. Histogram showing the distribution of 3′ pairing energies for miR-7 (red bars) and the average of 50 3′ shuffled variants (black bars) for all sites identified genome-wide by 6mer 5′ seed matches for miR-7. The inset illustrates shuffling of the 3′ end of miRNA sequence only (wavy purple line). Because the miRNA 5′ end was not altered, the identical set of target sites was compared for pairing to the 3′ end of real and shuffled miRNAs.
(D) 3′ pairing preferences for miRNA target sites. Histograms showing the ratio of the top 1% 3′ pairing energies for the set of 58 3′ non-redundant miRNAs and their shuffled variants. The y-axis shows the number of miRNAs for each ratio. Real miRNAs are shown in red; mutant miRNAs are shown in black. Left are shown combined 8- and 7mer seed sites. Right are shown combined 5- and 6mer seed sites. For combined 8- and 7mer seeds, 1% corresponds to approximately ten sites per miRNA; for combined 6- and 5mer, to approximately 25 sites. The difference between the real and mutated miRNAs improves if fewer sites per miRNA are considered.
(E) Non-random signal of 3′ pairing. Plot of the ratio of the number of target sites for the set of 58 3′ non-redundant miRNAs and their shuffled miRNA 3′ ends (y-axis) with 3′ pairing energies that exceed a given pairing cutoff (x-axis). 100% is the pairing energy for a sequence perfectly complementary to the 3′ end. As the required level of 3′ pairing energy increases, fewer miRNAs and their sites remain to contribute to the signal. Plots for the real miRNAs extended to considerably higher 3′ pairing energies than the mutants, but as site number decreases we observe anomalous effects on the ratios, so the curves were cut off when the number of remaining miRNAs fell below five.

