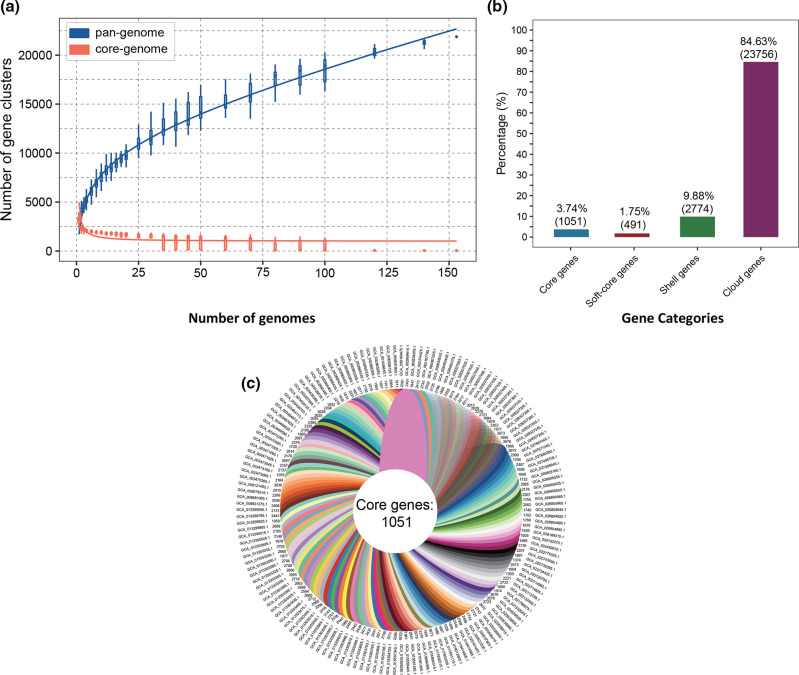
Fig. 2.
Pan-genome analyses of 152 R . gnavus genomes. (a) The pan-genome is represented by the accumulated number of new genes against the number of genomes added. The core-genome is represented by the accumulated number of genes attributed to the core-genomes against the number of added genomes. The red boxes denote the number of core genes discovered with the sequential addition of new genomes. (b) Gene occurrence plot of the core genes, soft-core genes, shell genes and cloud genes of R. gnavus . (c) Genomic diversity of 152 R . gnavus strains. Each strain is shown as a leaf. The number of core genes is shown in the centre. Strain-specific genes conserved only within a strain are presented at the ends of the leaves. The genome accession number of a strain is presented beside the leaf.

