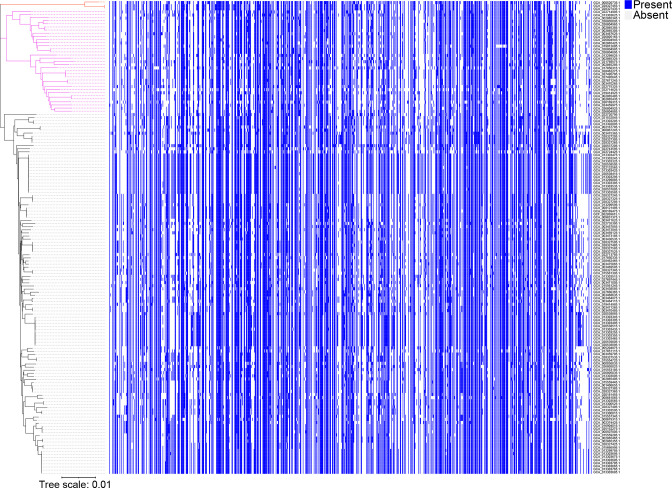
Fig. 3.
Pan-genome plot representing the gene presence/absence across the strains. Core-genome phylogroups are represented on the left as three clades coded in red, pink and black. In the plot, blue represents the presence of the gene(s), while light grey represents the absence of the gene(s) according to the results of the pan-genome analysis. Bar, 0.01 substitutions per nucleotide position.

