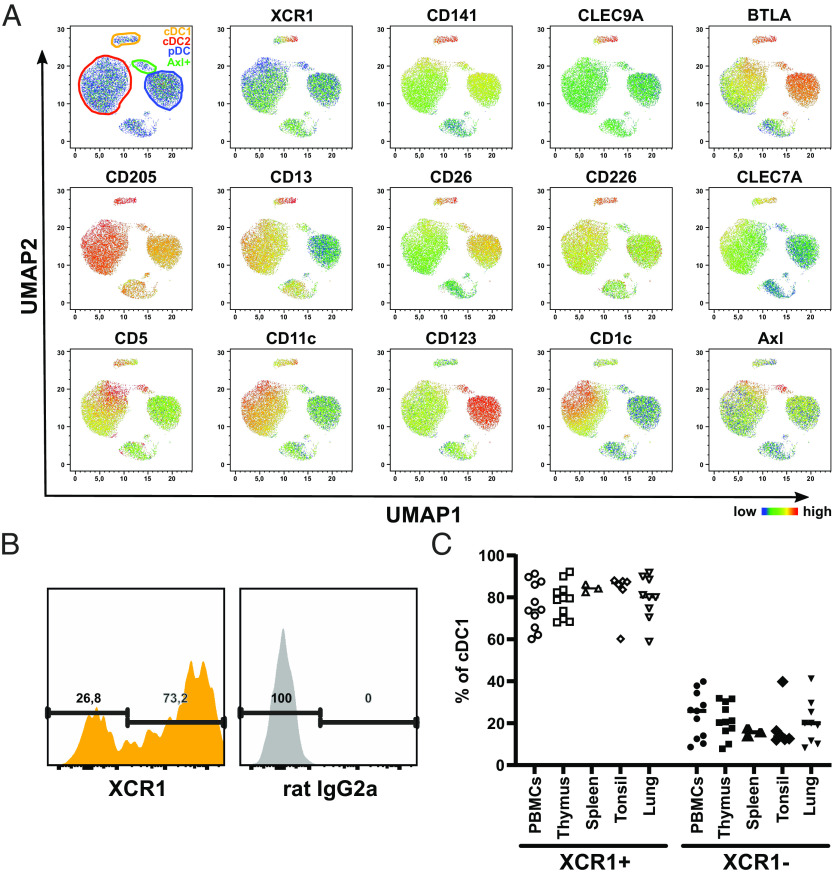
Fig. 1.
The cDC1 compartment comprises XCR1− and XCR1+ cells. (A) Single-cell suspensions of human blood were stained with a panel of fluorochrome-coupled antibodies (SI Appendix, Table S5). Samples were acquired using a BD LSRFortessa and analyzed using FlowJo software. After gating for living cells as shown in SI Appendix, Fig. S2, T cells, B cells, NK cells, and monocytes were excluded. The remaining HLA-DR+ cells were clustered using the algorithm UMAP. Scatter plots show UMAP with gated cDC1 (yellow-orange), cDC2 (red), pDC (blue) and Axl+ DC (green). Color-coded heat maps depict the expression of select markers for the identification of the different DC subpopulations. (B and C) Gated (B and C) blood, (C) lymphoid tissue and lung cDC1 as shown in SI Appendix, Fig. S2 were stained with PE-coupled anti-XCR1 (clone: S15046E, BioLegend) or appropriate isotype control (rat IgG2a). Cells were segregated into XCR1+ and XCR1− cells based on the signal in the isotype control. (B) Histograms show one representative blood donor. (C) Scatter plot (horizontal line: mean + SD) shows the ratio of XCR1+ and XCR1− cDC1 in blood, spleen, thymus, tonsil, and lung donors (n = 3 to 11).

