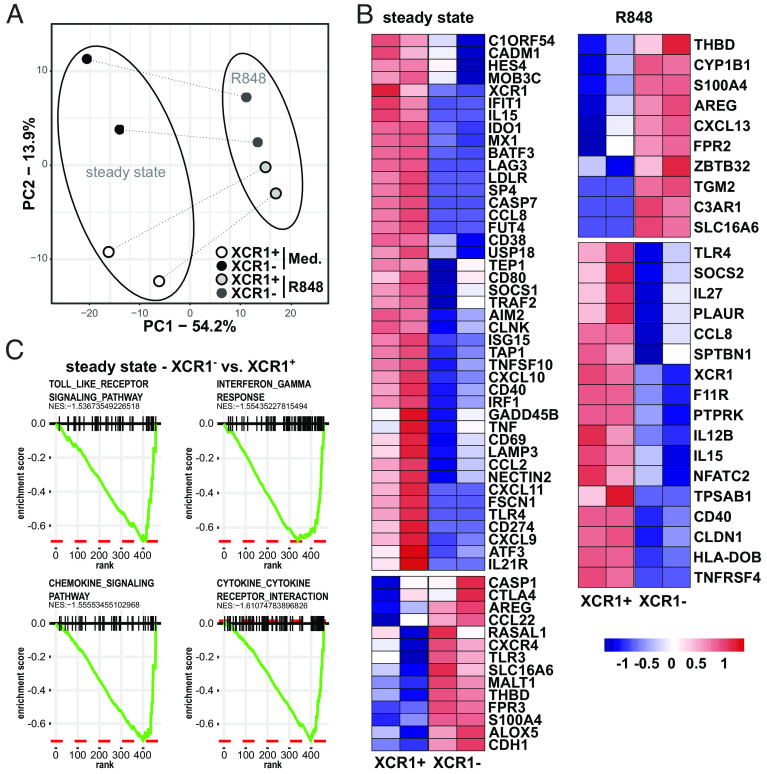
Fig. 2.
Transcriptional differences of XCR1− and XCR1+ cDC1. XCR1− and XCR1+ cDC1 were sorted as shown in SI Appendix, Fig. S4. Subsequently, cells were stimulated or not with 5 µg/mL R848 for 3 h. mRNA expression of 800 genes was determined using NanoString technology (770 genes from the nCounter Human Myeloid Innate Immunity V2 Panel and 30 DC- and inflammation-specific genes) as described before (44). (A) Eight samples (two donors, two subpopulations, two conditions) of 800 gene features were clustered using principal components analysis (PCA). Samples of XCR1− cDC1 are shown as black (steady state) and dark gray (R848) circles, while samples of XCR1+ cDC1 are depicted as white (steady state) and light-gray (R848) circles. (B) Heatmap shows DEGs between XCR1− and XCR1+ cDC1 in the steady state (cultured in medium for 3 h) or after stimulation with R848. (C) Gene expression values in (B) were analyzed by Gene Set Enrichment Analysis. Shown Pathways were significantly enriched in XCR1+ cDC1 compared to XCR1− cDC1 in the steady state (cutoff: a normalized enrichment score lower than −1.5 and P-value lower than 0.05).

