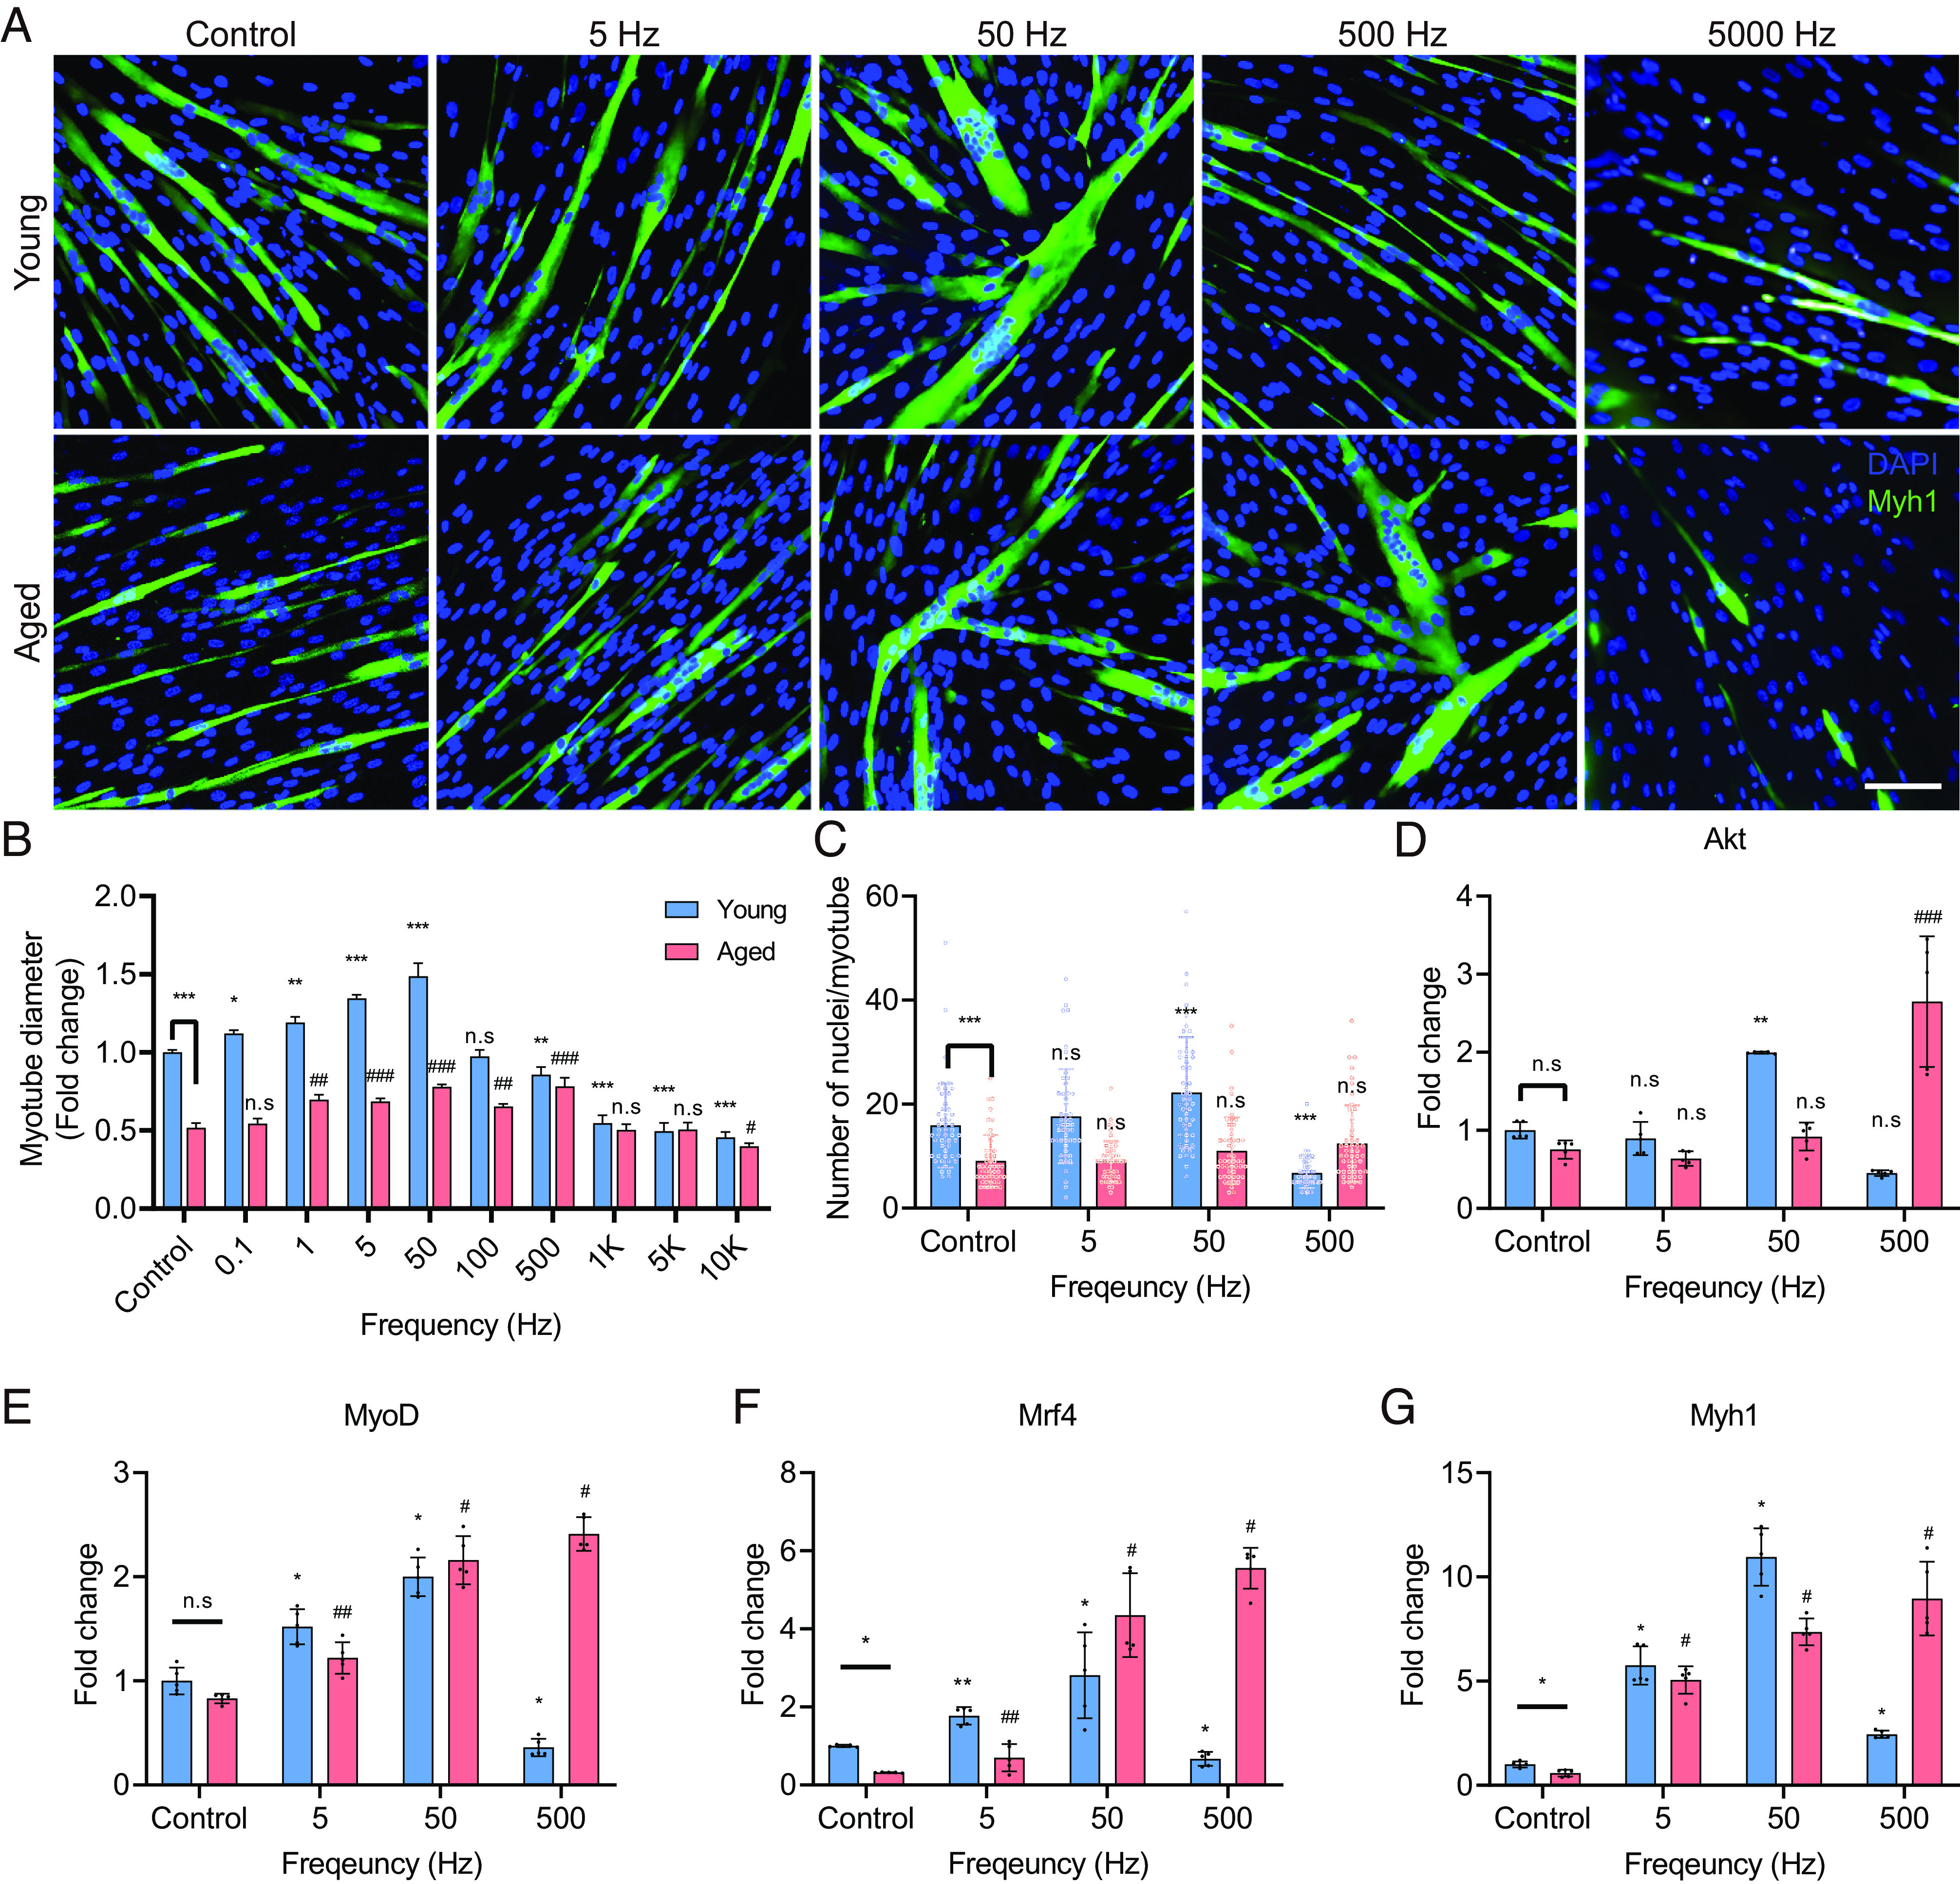
Fig. 3.

Specific ES conditions induce myotube differentiation. (A and B) Representative images (A) and quantification (B) of myotubes stained with Myh1 and nuclei, respectively. Optimal ES frequencies vary with age. (Scale bar, 100 μm.) (C) Quantification of the number of nuclei/myotube. The optimal ES frequency for hYskMC and hAskMC is 50 and 500 Hz, respectively. (D–G) mRNA expression levels of Akt (D), MyoD (E), Mrf4 (F), and Myh1 (G). The gene expression profiles are up-regulated at the appropriate ES condition. (*P < 0.05; **P < 0.01; ***P < 0.001; compared to young control, #P < 0.05; ##P < 0.01; ###P < 0.001; compared to aged control).
