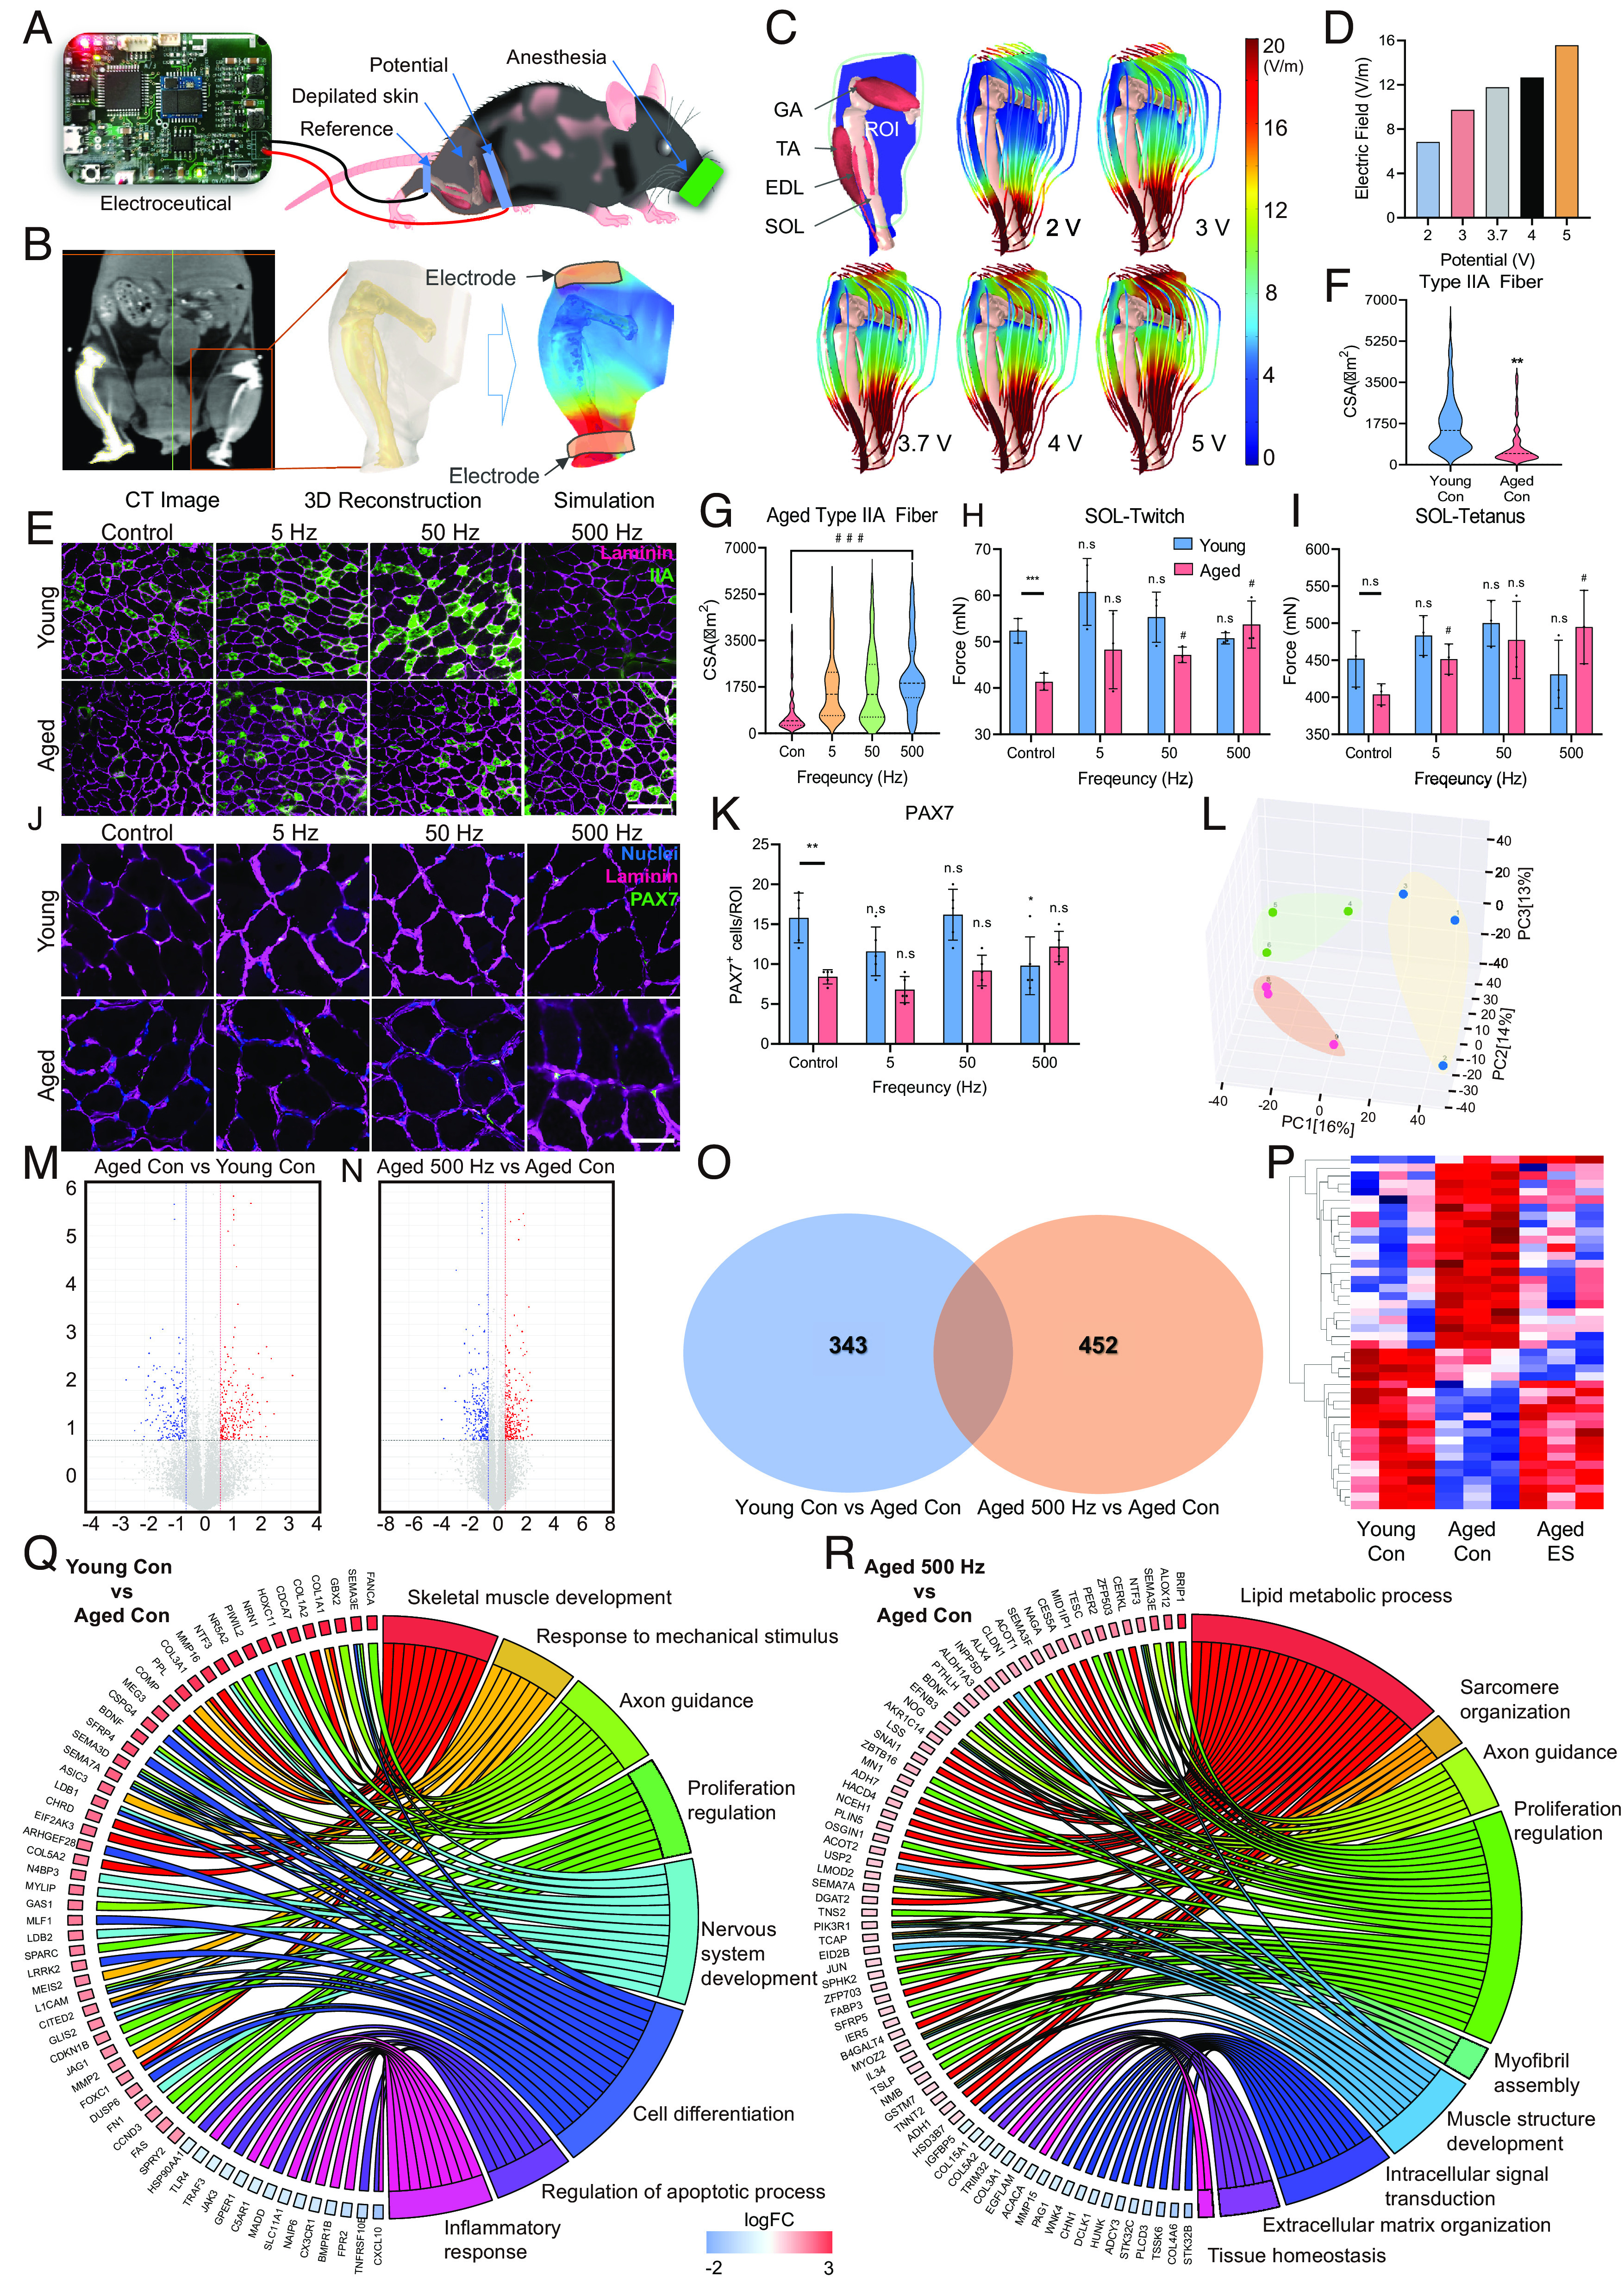
Fig. 6.

Validation of the silver electroceutical in aged mice. (A) Schematics of the preclinical ES experiment. (B) E-field simulation process in a mouse leg based on 3D anatomy reconstructed by CT images. (C) Simulation results of E-field distribution in a mouse leg. (D) Quantification result of E-field value in the ROI of a mouse leg. (E) Representative CSA images of Type IIA muscle fibers in young and aged mice (Green; Type IIA fiber, Magenta; Laminin). (Scale bar, 200 μm.) (F) Quantification of myofiber CSA in young versus aged mice. (G) Quantification of myofiber CSA for ES conditions in aged mice. (H and I) Isometric twitch (H) and tetanus contraction (I) force measurement of soleus muscles depending on ES conditions in young and aged mice. (J and K) Representative images (Scale bar, 50 μm.) (J) and quantification (K) of the expression of PAX7 (Green) and muscle fibers (Magenta; Laminin). (L) Result of PCA. (M and N) Volcano plot of RNA sequencing transcriptome data displaying the pattern of gene expression values for young control (M) and aged 500 Hz mice (N) relative to aged control mice. (O) Venn diagram of differentially expressed genes found in aged con/young con and aged 500 Hz/young con. (P) Gene clustering heatmap of RNA sequencing using TA muscle from mice. (Q and R) Gene ontology analysis results for young control (Q) and aged 500 Hz mice (R) relative to aged control mice. (*P < 0.05; **P < 0.01; ***P < 0.001; compared to young control, #P < 0.05; ##P < 0.01; ###P < 0.001; compared to aged control).
