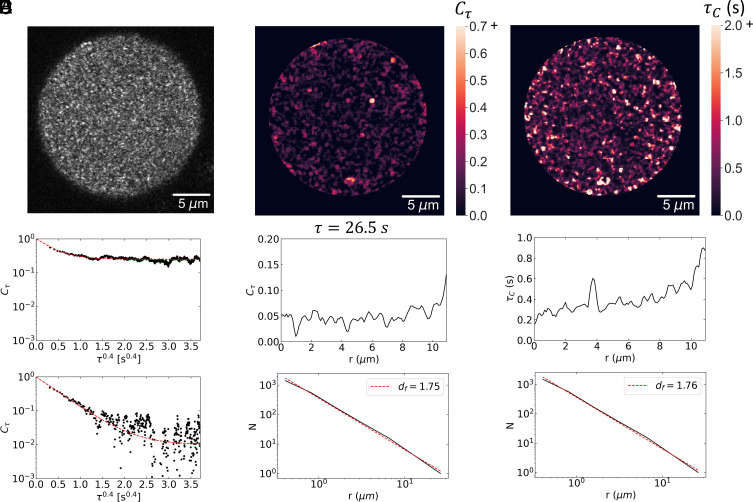
Fig. 4.
Confocal backscattering speckle fluctuation analysis: (A) Image of speckles from a 24-h condensate. (B) Temporal correlation function of two speckles showing stretched exponential decay to a plateau. The upper correlation function decays to a plateau, indicating a solid, while the plateau of the lower correlation function is at the noise level of the measurement. (C) Spatial map of the plateau region of the temporal correlation functions (D) Radial distribution of the value of at τ = 26.5 s, well into the plateau region (Top) and box counting analysis of the fractal dimension of the plateau regions using a threshold of . The structure is fractal with . The corresponding fractal dimension for the three-dimensional condensate is . (E) Spatial map of decay times of the stretched-exponential correlation functions. (F) Radial distribution of decay times exhibiting pronounced increase at the outer edge (Top) and box counting analysis of decay times greater than 0.5 s (Bottom). The structure is fractal with . The corresponding fractal dimension for the three-dimensional condensate is .

