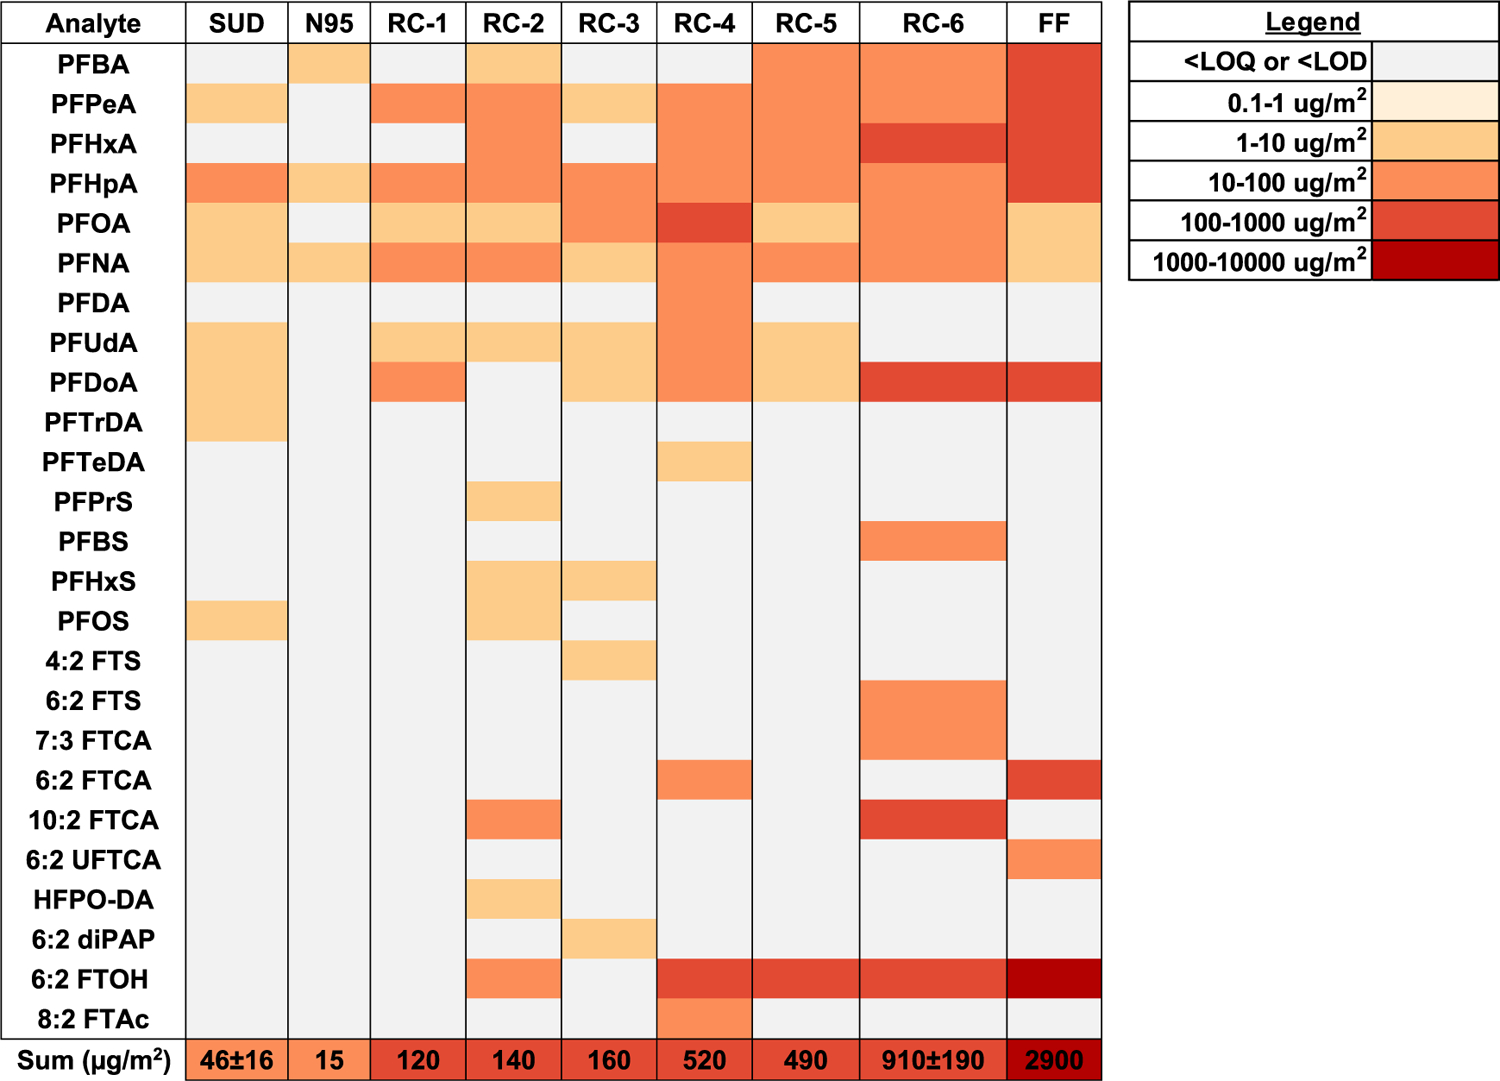
Figure 1.

Heat map of nonvolatile and volatile PFAS (μg/m2) in facemasks. (Only PFAS with at least one greater than LOQ concentration was included.) Layer concentration summed for samples with multiple layers (RC-1, RC-2, RC-4, RC-5, and FF). Average concentrations ± standard error for n = 3 replicates of SUD and RC-6. A similar heat map in units of ng/g is provided in the Figure S1.
