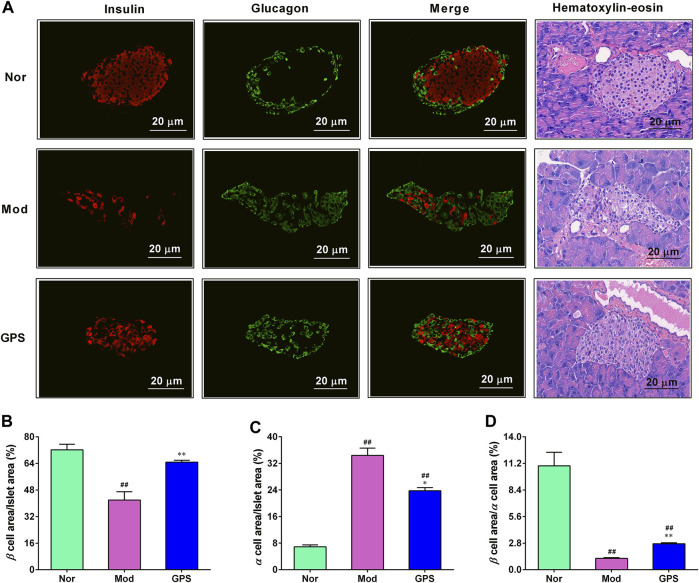
FIGURE 3.
GPS attenuated islet morphology in HFD and STZ-induced diabetic mice (A) Representative images of insulin (red) and glucagon (green) immunofluorescence staining of the pancreatic islets. Magnification of all images is at × 200 (B) Insulin-positive area to the total islet area (C) Glucagon-positive area to the total islet area (D) The ratio of insulin to the glucagon. Data are presented as mean ± SEM, n = 4. # p < 0.05; ## p < 0.01 vs. Nor group; *p < 0.05; **p < 0.01 vs. Mod group.

