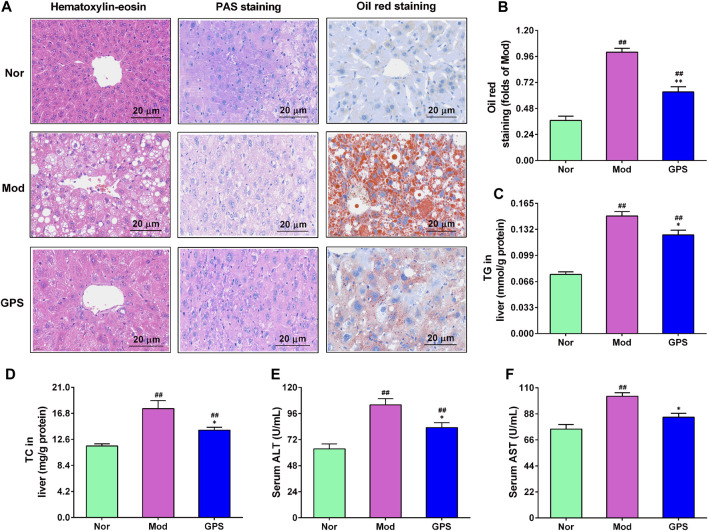
FIGURE 5.
GPS mitigated hepatic steatosis in HFD and STZ-induced diabetic mice (A) Representative images of hematoxylin-eosin (HE), periodic acid-Schiff (PAS), and oil red staining of the liver of the diabetic mice, n = 4. Magnification of all images were at ×200 (B) Statistical analysis of oil red level, n = 4 (C) TG in the liver, n = 10 (D) TC in the liver, n = 10 (E) Serum ALT activities. N = 10 (F) Serum AST activities, n = 10. Data are presented as mean ± SEM. # p < 0.05; ## p < 0.01 vs. Nor group; *p < 0.05; **p < 0.01 vs. Mod group.

