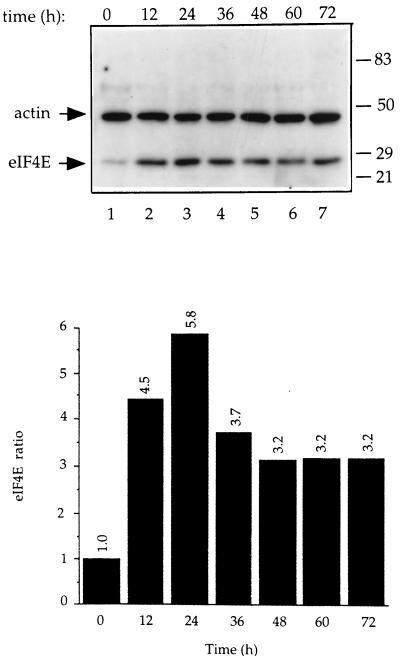
FIG. 3.
Time course of induction of eIF4E. (Upper panel) Total cell extract (25 μg) was prepared from C1 cells cultured in the absence of tetracycline for the indicated times. Extracts were immunoblotted and probed with a rabbit polyclonal anti-eIF4E antibody. The blot was subsequently probed with a mouse monoclonal anti-actin antibody to normalize for protein loading. After probing with 125I-labelled anti-rabbit and anti-mouse secondary antibodies, the amount of eIF4E expressed was quantitated with a Bas 2000 phosphorimager. (Lower panel) Quantitative analysis of the results presented in the upper panel. eIF4E expression levels were normalized against actin levels and are expressed as the ratios relative to the amount of eIF4E in C1 cells at time 0, which was set at 1. Results are representative of two experiments for which the values differed by less than 14%.

