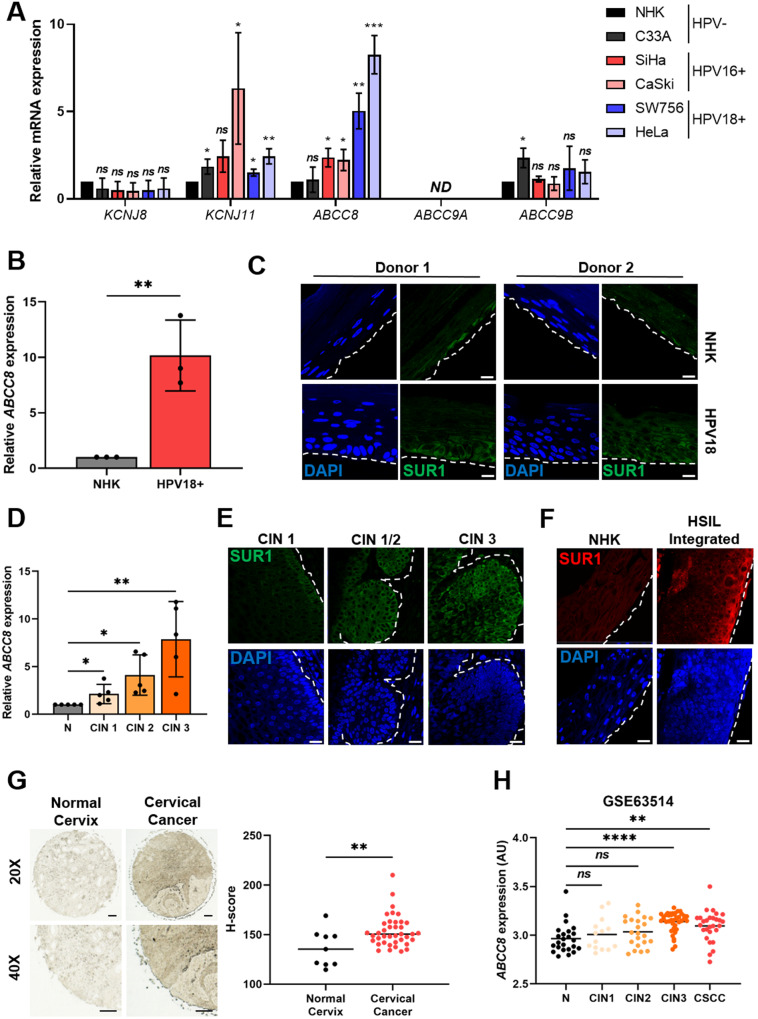
Fig. 2. HPV enhances expression of the SUR1 subunit of KATP channels.
A mRNA expression levels of KATP channel subunits in HPV- normal human keratinocytes (NHK) and a panel of five cervical cancer cell lines – one HPV- (C33A), two HPV16+ (SiHa and CaSki), and two HPV18+ (SW756 and HeLa) detected by RT-qPCR. Samples were normalised against U6 mRNA levels. Data are displayed relative to NHK controls. B ABCC8 mRNA expression in NHKs and keratinocytes containing episomal HPV18 genomes detected by RT-qPCR. Samples were normalised against U6 mRNA levels. C Representative immunofluorescence analysis of sections from organotypic raft cultures of NHK and HPV18+ keratinocytes detecting SUR1 levels. Nuclei were visualised with DAPI and the white dotted line indicates the basal layer. Two donor cell lines were used to exclude donor-specific effects. Images were acquired with identical exposure times. Scale bar, 40 μm. D ABCC8 mRNA expression in a panel of cervical cytology samples representing normal cervical tissue (N) and cervical disease of increasing severity (CIN 1 - 3) detected by RT-qPCR (n = 5 from each grade). Samples were normalised against U6 mRNA levels. E Representative immunofluorescence analysis of tissue sections from cervical lesions of increasing CIN grade. Sections were stained for SUR1 levels (green) and nuclei were visualised with DAPI (blue). Images were acquired with identical exposure times and the white dotted line indicates the basal layer. Scale bar, 40 μm. F Representative immunofluorescence analysis of sections from organotypic raft cultures of NHK and a W12 cell line presenting with HSIL morphology detecting SUR1 levels (red). Nuclei were visualised with DAPI (blue) and the white dotted line indicates the basal layer. Images were acquired with identical exposure times. Scale bar, 40 μm. G Representative immunohistochemistry analysis and scatter dot plots of quantification of normal cervical (n = 9) and cervical cancer (n = 39) tissue sections stained for SUR1 protein. Scale bar, 50 μm. H Scatter dot plot of expression data acquired from the GSE63514 dataset. Arbitrary values for ABCC8 mRNA expression in normal cervix (n = 24), CIN1 lesions (n = 14), CIN2 lesions (n = 22), CIN3 lesions (n = 40) and cervical cancer (n = 28) samples were plotted. Bars represent means ± SD of three biological replicates, unless stated otherwise, with individual data points displayed where possible. Ns not significant, *P < 0.05, **P < 0.01, ***P < 0.001, ****P < 0.0001 (Student’s t test).

