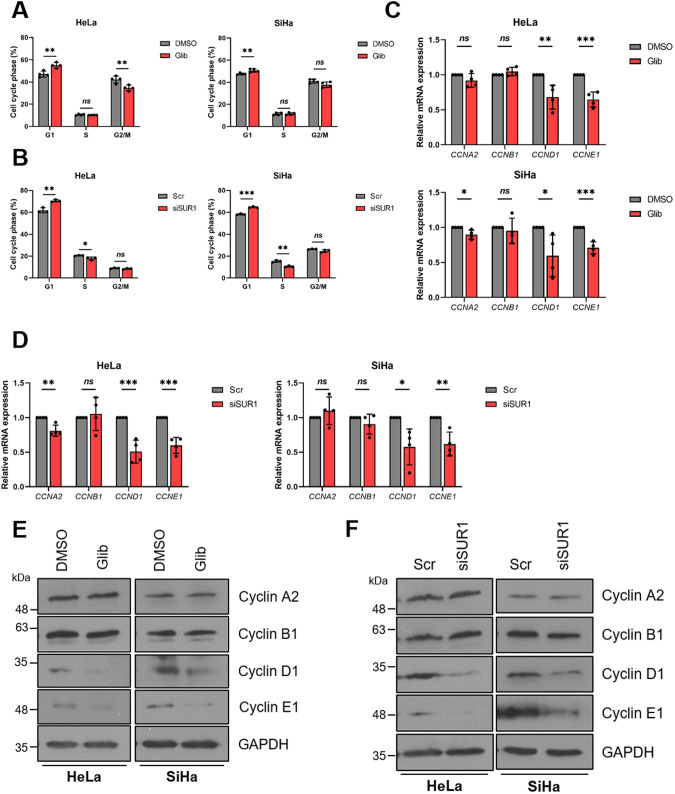
Fig. 7. KATP channel activity regulates progression through the G1/S phase transition.
A, B Flow cytometry analysis of cell cycle phase distribution of HeLa and SiHa cells after (A) treatment with either DMSO or glibenclamide (25 μM) for 48 h (n = 4) and (B) transfection of SUR1-specific siRNA. C, D mRNA expression levels of cyclins in HeLa and SiHa cells after (C) treatment with either DMSO or glibenclamide (10 μM) for 24 h (n = 4) or (D) transfection of SUR1-specific siRNA (n = 4) measured by RT-qPCR. Samples were normalised against U6 mRNA levels and data is displayed relative to the appropriate control. E, F Representative western blots of cyclin proteins in HeLa and SiHa cells after (E) treatment with either DMSO or glibenclamide (10 μM) for 24 h or (F) transfection of SUR1-specific siRNA. GAPDH served as a loading control. Bars represent means ± SD of three biological replicates (unless stated otherwise) with individual data points displayed. Ns not significant, *P < 0.05, **P < 0.01, ***P < 0.001 (Student’s t test).

