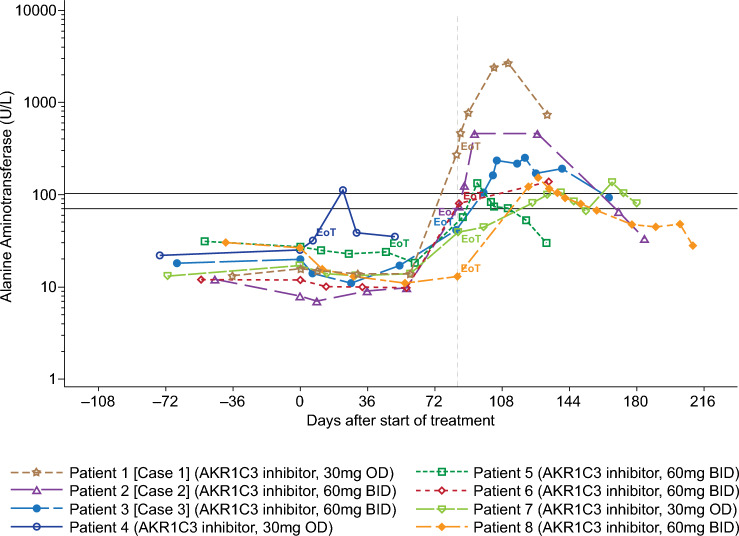
Fig. 3.
ALT values in participants with ALT > 3-fold the ULN. Only participants whose maximum value between the start of treatment and the end of the study exceeds 3 × ULN are included here. Lower and upper black horizontal lines correspond to 2 × ULN and 3 × ULN, respectively. Gray vertical dotted line corresponds to planned EoT visit at day 84 ± 4 days of treatment. ALT alanine aminotransferase, EoT end-of-treatment visit, ULN upper limit of normal

