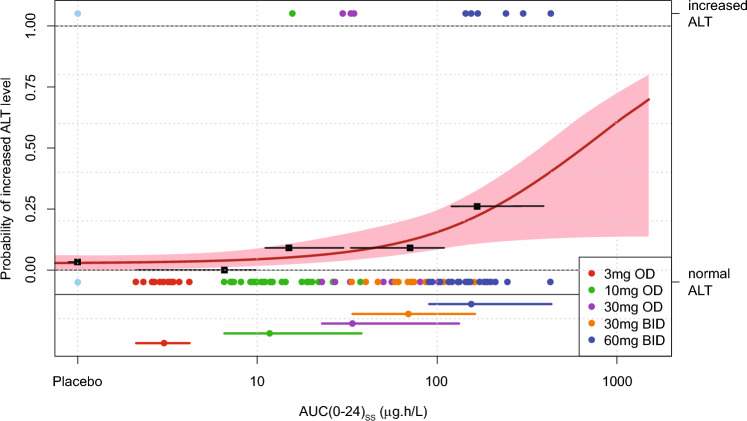
Fig. 5.
Exposure–response analysis for increase in ALT (ALT > 2-fold ULN). Exposure–response relationship of daily steady-state AUC [AUC(0–24)ss] and increased ALT level > 2 × ULN during the course of treatment. Single dots represent each participant of the study with (symbols above ‘1.00’, top end of graph) or without (symbols below ‘0.00’, at lower part of graph) increased ALT level > 2 × ULN versus its model-predicted daily steady-state AUC. The black squares and horizontal bars represent observed ‘increased ALT (> 2 × ULN) rate’ and range of exposure in the different exposure quartiles. Solid red line (red shaded area) represents Emax-model fit (95% confidence band). Dots and horizontal bars at bottom of graph indicate median and range of exposure within respective treatment group. Color of symbols and bars represent the treatment group. Note, in the placebo group, 1 out of 31 participants included in this analysis had increased ALT level > 2 × ULN (at baseline). ALT alanine aminotransferase, AUC(0–24)ss steady-state area under the concentration–time curve for 24 h, BID twice daily, Emax maximum effect that can be attributed to the drug, ER exposure–response, OD once daily, ULN upper limit of normal

