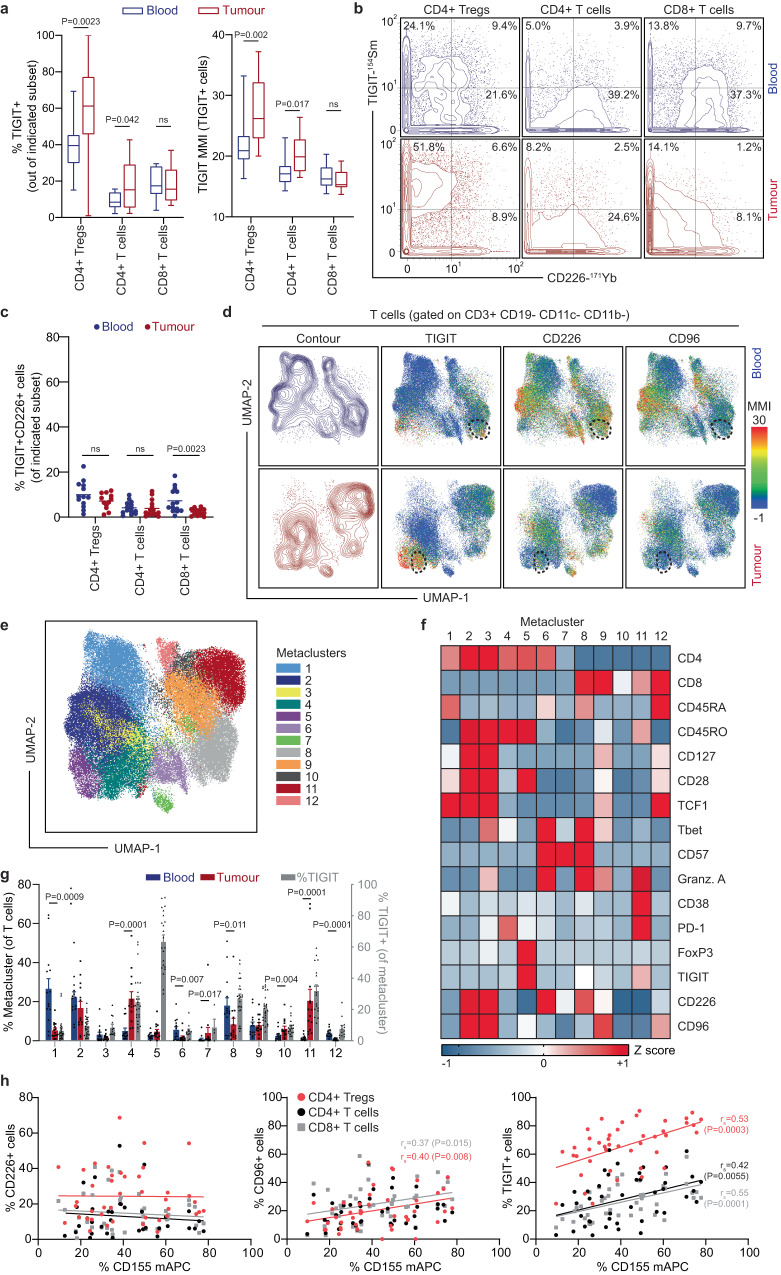
Fig. 1. Mass cytometry analysis of peripheral blood and dissociated tumour cell (DTC) samples from renal and lung cancer patients shows limited co-expression of CD226 and TIGIT on T cells.
a Frequency (left) and expression level (right) of TIGIT on CD45RA- CD4+ Tregs, CD4 + T cells, or CD8 + T cells in blood (blue) or tumour (red) samples. Relative TIGIT expression intensity was determined by median metal intensity (MMI) of TIGIT+ cells within each subset. Boxes depict the 25th-75th percentile with a line showing the median. Whiskers display minimum to maximum values. n = 14 matched patient samples. b Co-expression of TIGIT and CD226 was investigated on CD45RA- CD4+ Tregs, CD4+ T cells (non-Tregs), and CD8+ T cells from the blood and tumour. Plots display the frequency of singly or coexpressing populations on concatenated files of the matched blood or tumour samples. c Mean frequency of cells co-expressing TIGIT and CD226 in each CD45RA- T cell subset from blood and tumour. n = 14 matched samples (parent populations with <50 events excluded). d UMAP analysis performed on T cells from matched blood and tumour samples (n = 14 of each). Samples with greater than 3,000 T cell events (n = 19) were downsampled to 3,000 events prior to concatenation. UMAP projections show concatenated T cells from the blood (top; n = 35,691 events) or tumour (bottom; n = 42,000 events), highlighting contour (left) or median metal intensity (MMI) of TIGIT, CD226, and CD96 (right). Arbitrary dashed lines are used to highlight visual examples of discrete and co-expression patterns of TIGIT and CD226. e FlowSOM metaclusters were created on T cells concatenated from all matched samples and projected onto the same UMAP as in d. f Expression intensity heatmap of the indicated markers for each of the 12 FlowSOM metaclusters in e. Color scale indicates row-adjusted z-score expression for each marker. g Mean frequency (±SEM) of T cells in each metacluster for each individual matched sample (n = 14). Gray bars represent the frequency of TIGIT+ events (per biaxial gating) within each metacluster (blood and tumour samples are combined; n = 28, except where <50 events in parent population; statistical differences between blood and tumour are listed in Supplementary Table 3). h Plots displaying the correlation of the frequency of CD155 expression on myeloid antigen-presenting cells (mAPC) with the frequency of CD226+ (left), CD96+ (middle), and TIGIT+ (right) cells from CD4+ Tregs (red circles), CD4+ T cells (black circles), or CD8+ T cells (gray squares) in the tumour microenvironment (n = 44). Linear regression lines and Spearman’s Rho (rs) are shown for correlations that were significant (Two-tailed; P < 0.05, as indicated). Non-parametric matched-pairs two-tailed Wilcoxon tests were used to determine differences between PBMCs and DTCs. Source data are provided as a Source Data file.

