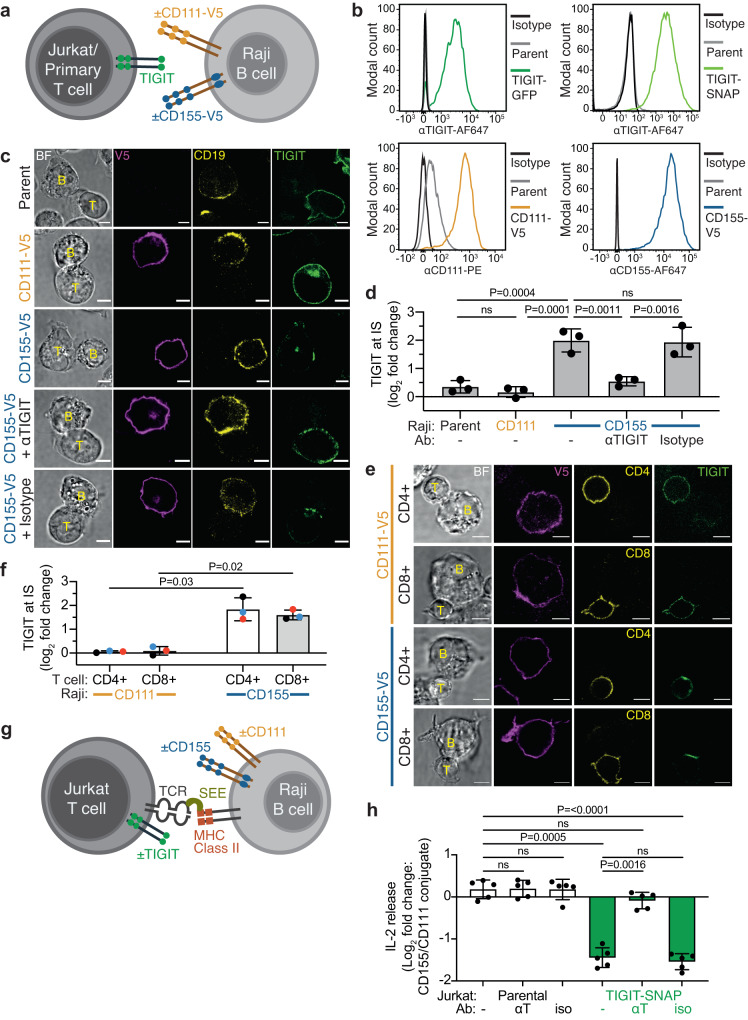
Fig. 2. TIGIT accumulates at the Immune Synapse (IS) in a ligand-dependent manner and inhibits T-cell intrinsic activation.
a Schematic depicting the model system employed to visualise TIGIT on the surface of T cells when interacting with Raji B cells expressing different nectin ligands. b Flow cytometry analysis showing the expression of TIGIT in Jurkat cells (above) and CD111 and CD155 in Raji cells (below), in both the parental and expression lines together with isotype-matched controls. c Confocal microscopy images showing TIGIT-GFP (green) on the surface of Jurkat cells (T) conjugated for 20 mins with different Raji cell (B) populations, as indicated to the left of the panel. CD19 (yellow) is used to mark Raji cells and a V5 stain labels expressed nectins (magenta). Respective brightfield images (BF) are also provided. The bottom two rows show Jurkat T cells that have been preincubated with either an antagonistic TIGIT antibody or an isotype-matched control. d Mean log2 fold change in synaptic TIGIT enrichment in Jurkat cells, from the conjugates shown in c (±S.D.; n = 3 independent experiments; adjusted P values from a one-way ANOVA with Tukey’s multiple comparisons are given; ns = not significant). e Representative confocal microscopy images showing TIGIT (green) on the surface of primary T cells conjugated with different Raji B cell populations, as indicated to the left. CD4 and CD8 (yellow) were stained to mark T cell subsets, and BF provided. f Mean log2 fold change (±S.D., n = 3 independent donors matched by colour) in synaptic TIGIT enrichment in primary T cells, from the conjugates shown in e. Adjusted P values from a paired T-test are given (Holm-Šídák method). g Schematic depicting the model system employed to test the inhibitory effect of TIGIT on the surface of Jurkat T cells when interacting with cells expressing different nectin ligands. Staphylococcal Enterotoxin E (SEE) was used to stimulate Jurkat cells. h Relative amounts of IL-2 released from either parental or TIGIT-SNAP-expressing Jurkat cells after co-incubation with SEE-pulsed Raji cells for 6 h. Data is shown as the mean log2 fold changes between Raji-CD155 conjugates compared to Raji-CD111 conjugates (±S.D., n = 5 independent experiments with adjusted P values from a one-way ANOVA with Holm-Šídák’s multiple comparisons displayed). Cells pre-incubated with an antagonistic TIGIT antibody (αT) or an isotype-matched control (iso) are shown, as indicated. All scale bars = 5 µm. Source data are provided as a Source Data file.

