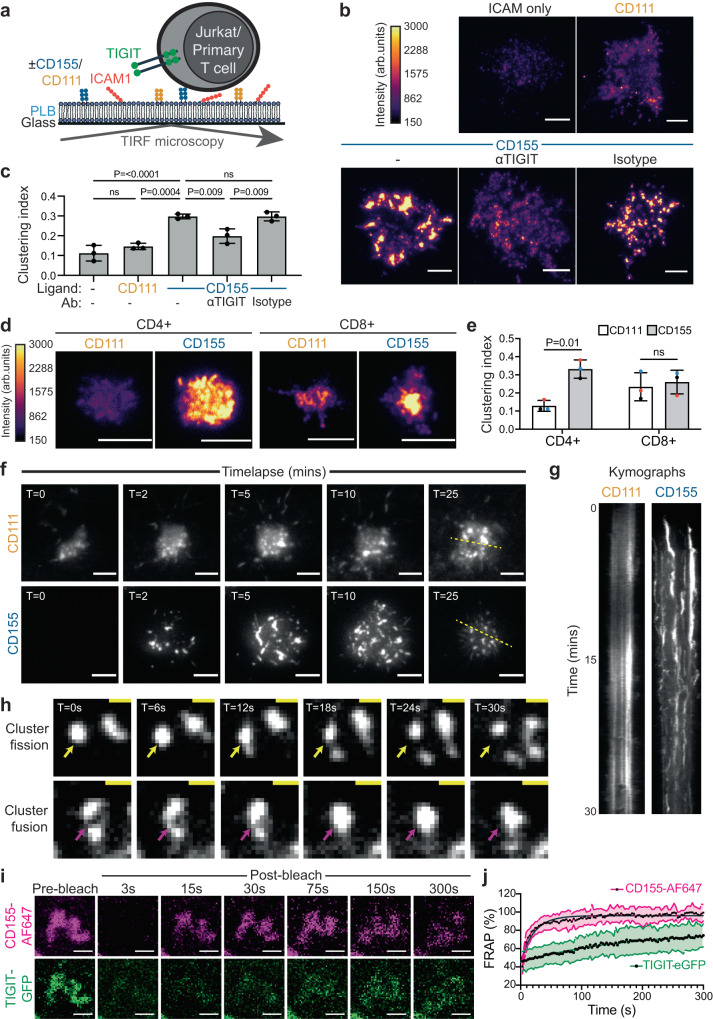
Fig. 3. TIGIT assembles into dense, dynamic clusters at the Immune Synapse (IS) in a ligand-dependant manner.
a Schematic depicting the model system employed to visualise TIGIT at the IS of T cells upon ligation. TIGIT expressing T cells interact with Planar Lipid Bilayers (PLB) containing laterally mobile ligands and imaged with Total Internal Reflection Fluorescence (TIRF) microscopy. b TIRF microscopy images showing TIGIT-GFP at the IS of Jurkat cells that have interacted with PLBs loaded with ICAM-1 (100 molecules/μm2), and either CD111 or CD155 (400 molecules/μm2) for 20 mins. Cells preincubated with an antagonistic TIGIT antibody or an isotype-matched control are shown, as indicated. c Mean degree of TIGIT clustering measured from the images shown in b (±S.D.; n = 3 independent experiments with adjusted P values from a one-way ANOVA with Tukey’s multiple comparisons shown; ns = not significant). d Representative TIRF microscopy images showing the spatial distribution of TIGIT at the IS of primary CD4+ and CD8 + T cells that have interacted with PLBs loaded with ICAM-1, and the ligands CD111 or CD155 for 20 mins, as in b. In both b and d the fluorescent intensities have been scaled equally, and the colour scales provided. e Mean degree of TIGIT clustering measured from the images shown in d (±S.D., n = 3 individual donors). Adjusted P values from a paired T-test with Holm-Šídák’s multiple corrections are displayed. f Video stills from live TIRF microscopy imaging of Jurkat T cells expressing TIGIT-SNAP interacting with PLBs containing ICAM-1 and either CD111 or CD155 (as in b). Acquisition times are indicated at the top left (mins). g Kymographs showing a single spatial position, as indicated by the dashed yellow line in f, over time. h Zoomed video stills from Jurkat TIGIT-SNAP on PLBs containing ICAM-1 and CD155, from f, displaying occurrences where TIGIT clusters appear to split (top row, yellow arrow) or fuse (bottom row, magenta arrow). Arrows mark specific xy locations, and time intervals are displayed above. i Confocal microscopy images of a FRAP experiment showing the recovery of both CD155-AF647 within the PLB and TIGIT-GFP on the surface of Jurkat cells within clusters. PLBs contain both ICAM-1 and CD155-AF647. Images were taken before photobleaching (Pre-bleach), and at the indicated times (in seconds) following photobleaching (Post-bleach). j FRAP profiles of both CD155-AF647 and TIGIT-GFP from cells measured as shown in i. Data is presented as the mean ±S.D. (n = 11 cells from 2 independent experiments). Scale bars = 5 μm (b, d, f) and 1 µm (h, i). Source data are provided as a Source Data file.

