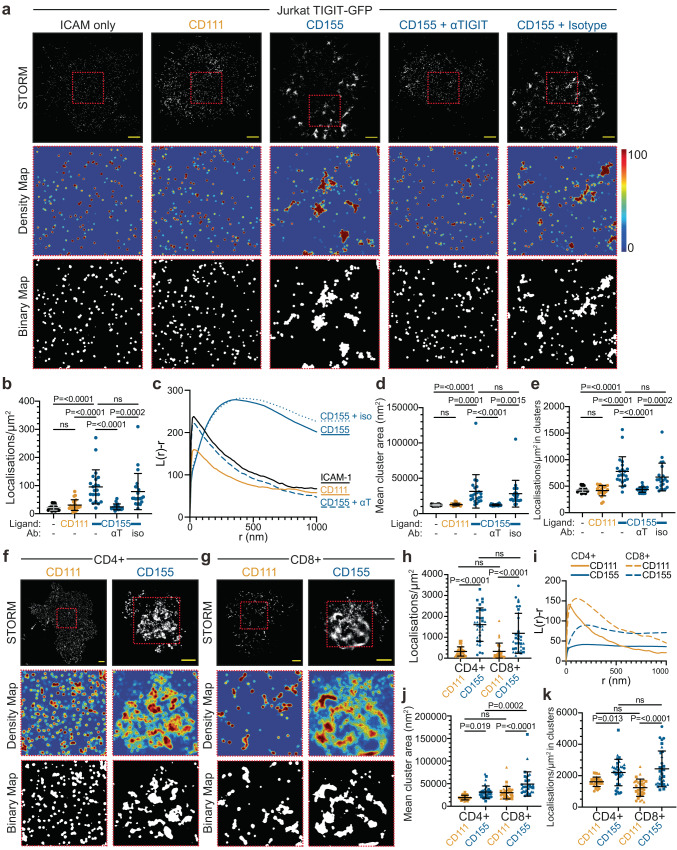
Fig. 4. Single molecule localisation microscopy reveals extent of TIGIT clustering upon ligation.
a dSTORM imaging of TIGIT-GFP in Jurkat cells that have interacted with Planar Lipid Bilayers (PLBs) loaded with ICAM-1 (100 molecules/μm2), and the indicated nectin ligands (400 molecules/μm2) for 20 mins. Cells pre-incubated with an antagonistic TIGIT antibody (αT) or an isotype-matched control (iso) are shown, as indicated. Representative STORM images are shown in the top row, scale bar = 2 μm. Smaller regions (5 μm x 5 μm; dashed red boxes) were subjected to cluster analysis (see methods) and Getis and Franklin density maps and binary maps showing identified clusters are displayed below. b–e Quantitative analysis of the single molecule localisation images shown in a. n = ≥22 (representing a 25 μm2 region from a single cells), examined over 3 independent experiments, with adjusted P values from one-way ANOVA with Tukey’s multiple comparisons shown (ns = not significant). Mean density of TIGIT localisations (b), mean Ripley’s H function at different clustering radii (c), mean cluster area (d; with each datapoint representing the mean cluster size per region of a single cell) and mean density of events within clusters (e). f–g dSTORM imaging of TIGIT in primary peripheral blood-isolated CD4+ (f) and CD8+ (g) T cells on PLBs loaded with ICAM-1, and the indicated nectin ligands, as in a. Representative STORM images are shown in the top row, scale bar = 1 μm. Smaller regions (3 μm x 3 μm; dashed red boxes) were subjected to cluster analysis, as in a. h–k Quantitative analysis of the single molecule localisations depicted in f and g, as in b–e. n = ≥30 cells from 3 independent donors, as depicted through symbol shape. Adjusted P values from a one-way ANOVA with Tukey’s multiple comparisons are shown. Error bars represent standard deviation throughout. Source data are provided as a Source Data file.

