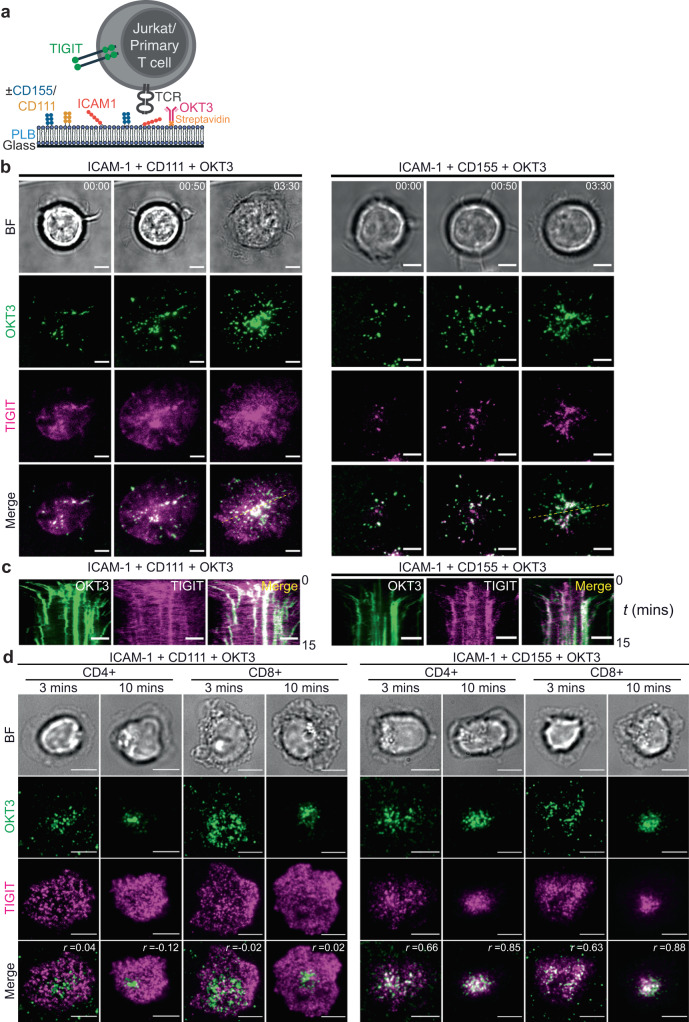
Fig. 5. TIGIT clusters are proximal to T-cell receptor (TCR) clusters.
a Schematic depicting the model system employed to visualise TIGIT and the TCR at the Immune Synapse (IS) of T cells upon co-ligation. Both Jurkat T cells expressing TIGIT-SNAP, and peripheral blood-isolated primary T cells that express TIGIT endogenously interact with PLBs containing nectin ligands (CD111 or CD155), ICAM-1 and the directly labelled, mono-biotinylated stimulatory TCR antibody OKT3 and imaged with TIRF microscopy. b Video stills of Jurkat T cells expressing TIGIT-SNAP and labelled with dye (magenta) interacting with PLBs containing ICAM-1 (100 molecules/μm2), CD111 or CD155 (400 molecules/μm2) and fluorescently labelled OKT3 (100 molecules/μm2; green), using live TIRF microscopy. Acquisition times are indicated at the top right of each column of images (mins:secs). Brightfield images are shown above. The data are representative of 3 independent experiments. c Kymographs showing a single spatial position, as indicated by the dashed yellow line in b, over time. d Representative TIRF microscopy images showing the relative localisation of TIGIT (antibody labelled; magenta) and the TCR (green) upon interaction with PLBs, as in b, in fixed primary CD4+ and CD8 + T cells at the indicated times. Throughout, scale bars = 5 μm. The data are representative of 3 independent donors. Pearson correlation coefficients (r) are displayed on merged images.

