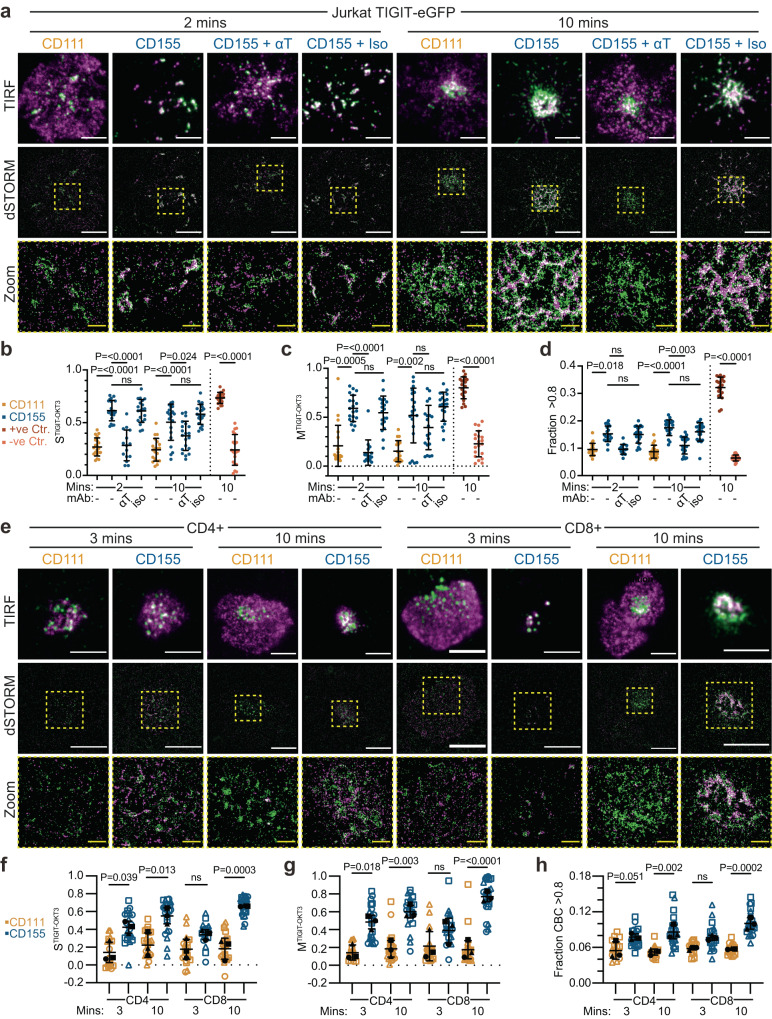
Fig. 6. Super resolution microscopy reveals the nanoscale proximity of TIGIT and TCR clusters.
a Two-colour dSTORM imaging of TIGIT-GFP (magenta) in Jurkat cells that have interacted with PLBs loaded with ICAM-1 (100 molecules/μm2), the indicated nectin ligands (400 molecules/μm2) and directly labelled, mono-biotinylated stimulatory TCR antibody OKT3 (green) for the indicated timepoints. Cells pre-incubated with an antagonistic TIGIT antibody (αT) or an isotype-matched control (iso) are shown, as indicated. Representative TIRF and dSTORM images are shown in the top and middle rows, respectively. b–d Quantitative analysis of the colocalisation between TIGIT and TCR in Jurkat cells as shown in a; n = ≥15 cells per condition, representative of 3 independent experiments, with adjusted P values from a one-way ANOVA with Tukey’s multiple comparisons (b) or Kruskal-Wallis tests with Dunn’s multiple comparisons (c, d) are shown. Positive controls represent TIGIT labelled with both a GFP nanobody and a TIGIT antibody, with the negative control representing the same data but with the XY coordinates of one channel being swapped (Supplementary Fig. 12). Mean (±S.D.) Spearman rank correlations (b) and Mander’s coefficients (c) for TIGIT-OKT3 localisations across each cell. d Mean (±S.D.) fraction of localisations that have a score of >0.8 from a coordinate-based colocalisation analysis across single cells. e Two-colour dSTORM imaging of TIGIT (magenta) and PLB-bound OKT3 (green) in primary peripheral blood-isolated CD4+ and CD8 + T cells on PLBs, as in a. Representative TIRF and dSTORM images are shown in the top and middle rows, respectively. f–h Quantitative analysis of the colocalisation between TIGIT and TCR in primary T cells as shown in e; n = ≥15 cells (depicted in blue or orange) from 3 individual donors (as shown in black and matched by shape) with adjusted P values from one-way ANOVA with Holm-Šídák’s multiple corrections on the means of each donor displayed. Mean (±S.D.) Spearman rank correlations (f) and Mander’s coefficients (g) for TIGIT-OKT3 localisations across each cell. h Mean (±S.D.) fraction of localisations that have a score of >0.8 from a coordinate-based colocalisation analysis across single cells. In a and e, white scale bars = 5 μm, zoomed regions (5 μm x 5 μm; dashed yellow boxes) are displayed below with yellow scale bars = 1 μm. Source data are provided as a Source Data file.

