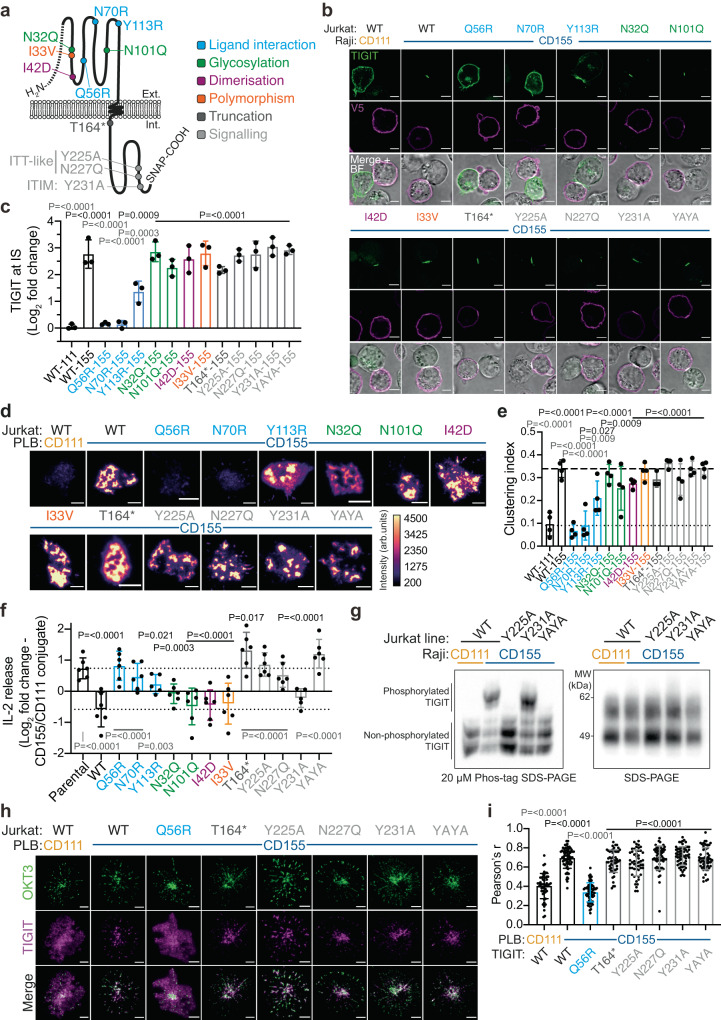
Fig. 7. ITT-like motif is fundamental to T-cell intrinsic TIGIT-mediated inhibition although functionally null-mutants can still co-cluster with the TCR.
a Schematic depicting individual point mutations introduced into TIGIT-SNAP. b Representative confocal microscopy images showing WT and mutant forms of TIGIT-SNAP (green) on the surface of Jurkat T cells conjugated for 20 mins with different Raji B cell populations (either CD111- or CD155-expressing; stained via V5 and shown in magenta). A merged fluorescence-BF image is also provided. c Mean log2 fold change (±S.D., n = 3 independent experiments) in synaptic TIGIT enrichment in Jurkat T cells, from the conjugates shown in b. Adjusted P values from a one-way ANOVA with Šídák’s multiple comparisons are displayed, with differences from the WT-111 condition displayed in black and the WT-155 condition displayed in grey. d Representative TIRF microscopy images of WT and mutant forms of TIGIT-SNAP at the IS of Jurkat cells that have interacted with PLBs loaded with ICAM-1, and CD111 or CD155 for 20 mins, as in Fig. 2b. Intensities have been scaled equally, and colour scales provided. e Mean degree of TIGIT clustering measured from the images shown in d (±S.D., n = 3–4 independent experiments, as indicated). Adjusted P values from a one-way ANOVA with Dunnett’s multiple comparisons are displayed, and coloured as in c. f ELISA data showing the relative amount of IL-2 released from either parental or different forms of TIGIT-SNAP-expressing Jurkat cells after co-incubation with SEE-pulsed Raji cells. Data is shown as the mean log2 fold changes between Raji-CD155 conjugates compared to Raji-CD111 conjugates, ± S.D. (n = ≧5 independent experiments with adjusted P values from a one-way mixed-effects analysis with a Dunnett’s multiple comparison test displayed). Differences from the parental condition are displayed above in black and from the WT condition displayed below in grey. g Western blot analysis of TIGIT using either Phos-tag SDS-PAGE (left) or standard SDS-PAGE to examine TIGIT phosphorylation in Raji-Jurkat conjugates, as labelled above. Data are representative of 3 independent experiments. h Representative TIRF microscopy images of different forms of TIGIT (SNAP labelled; magenta) and the TCR (OKT3 in PLB; green) in Jurkat cells upon interaction with PLBs containing ICAM-1, either CD111 or CD155, and fluorescently labelled OKT3 (100 molecules/μm2), for 10 mins. i Mean Pearson’s correlation coefficient (±S.D; n = ≧50 cells from 2 independent experiments) between TIGIT and OKT3 from the images shown in h. Adjusted P values from a Kruskal-Wallis test with Dunn’s multiple comparisons are shown, and coloured as in c. All scale bars = 5 μm. Source data are provided as a Source Data file.

