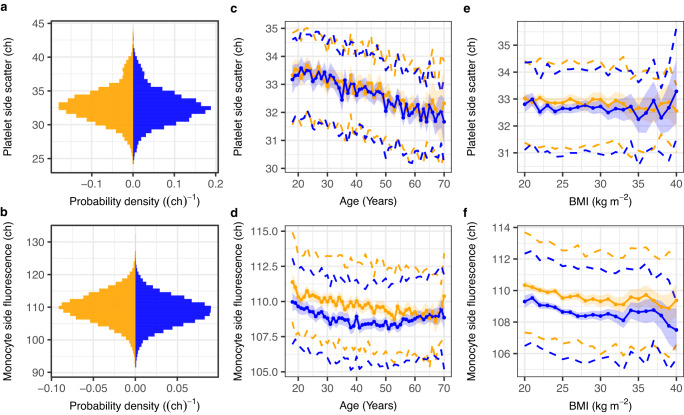
Fig. 2. The distributions of selected ncCBC traits and their covariation with age, sex and BMI.
Summary plots for two exemplar technically adjusted traits (Methods) using data from participants who contribute to the GWAS of the respective trait. The upper row and lower row panels correspond respectively to the platelet side scatter (PLT-SSC, n = 29,675) and monocyte side fluorescence (MO-SFL, n = 39,586) phenotypes. a, b Probability density histograms stratified by sex: female (orange) and male (blue). c, d Covariation between the phenotype and participant age stratified by sex. Parameters of the stratified trait distributions were estimated in bins corresponding to years of age. The linearly interpolated coloured points show estimates of the within strata-means and the underlying coloured ribbons show the corresponding 95% confidence intervals. The dashed lines show estimates of the upper and lower quartiles. e, f Covariation between each trait and body mass index (BMI). Estimates of sex stratified summaries were made in bins of 1 kg m−2. The components of the plots are as for (c, d). Analogous plots for all 63 traits are presented in Supplementary Figs. 1–3.

