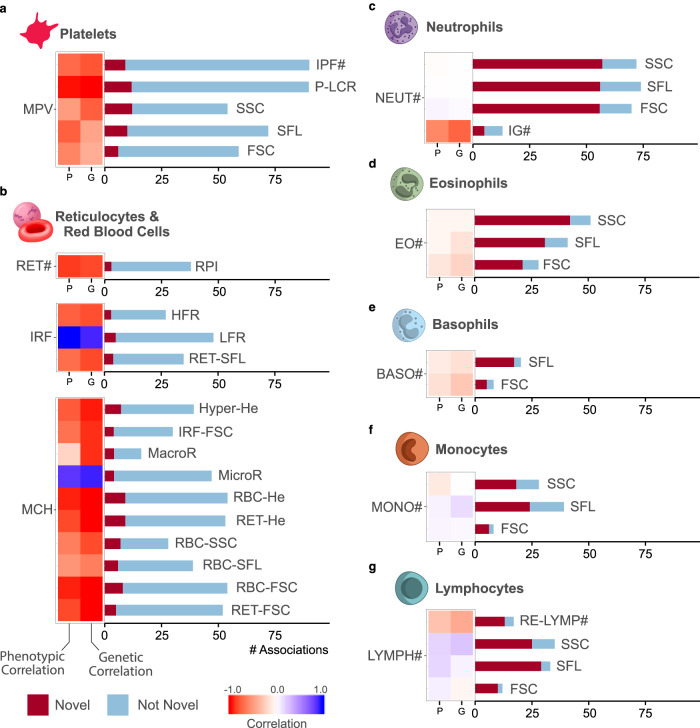
Fig. 3. The distribution and novelty of association signals by cell-type.
a–g Each panel presents statistics for selected ncCBC traits of the given cell-type. The heat map on the left of each subplot shows the estimated phenotypic (left) and genetic (right) correlation between the cCBC trait indicated to its left and the ncCBC trait corresponding to each horizontal bar. (Each ncCBC trait has been grouped with the cCBC trait studied in Vuckovic et al.3,4 with which it has maximal absolute phenotypic correlation in the study sample.) The bar plot on the right of each subplot indicates the number of distinct (conditionally significant) associations identified for each ncCBC trait and the number of distinct associations with variants that do not fall into a LD clump with a variant reported to be associated with a blood trait of the same cell-type by Vuckovic et al. or Chen et al. (‘Novel’)3,4. The absolute genetic correlations between the ncCBC and cCBC traits of white cells are lower than those of red cells and platelets. This is reflected in the variation between cell-types of the proportion of identified associations that are novel. We thank Joanna Westmoreland for the artwork in (a–g).

