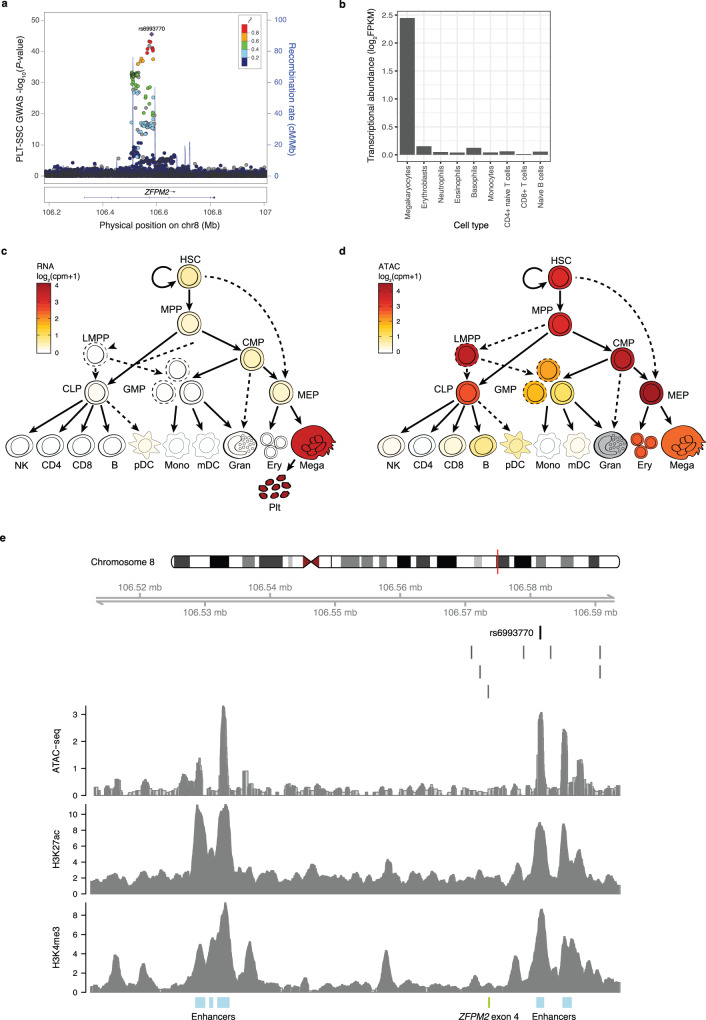
Fig. 5. The association of rs6993770 with PLT-SSC is mediated by ZFPM2 expression.
a A LocusZoom plot for the ZFPM2 locus105. Each dot corresponds to a variant tested for association. The x-axis represents the physical position on chromosome 8 in GRCh37 coordinates. The (left-hand) y-axis represents the −log10(P-value) from a univariable BOLT-LMM test for additive allelic association between the imputed genotypes of the variant and PLT-SSC (n = 29,675). The colour of the dot represents the LD (r2) in the study sample between the corresponding variant and rs6993770. The blue line represents an estimate of the local recombination rate (right-hand y-axis). Conditional analysis identified a single association signal in the 82 kb interval of low recombination containing rs6993770. b The abundance of ZFPM2 transcripts (log2FPKM) in MKs, erythroblasts, neutrophils, eosinophils, basophils, monocytes, CD4+ naive T cells, CD8+ T cells, and naive B cells, in which cell-types ZFPM2 transcription is limited to MKs31. c ZFPM2 transcript expression is higher in platelets, MKs and their precursor cell-types—MEP (megakaryocyte-erythroid progenitor cells), CMP (common myeloid progenitor), MPP (multipotent progenitor), and HSC (hematopoietic stem cell)—than in other blood cell and blood cell precursor cell-types. d ATAC-seq applied to multiple blood cell-types show that rs6993770 lies in an open chromatin region in the platelet precursor cell-types MK, MEP, CMP, MPP and HSC. e Measurements of epigenetic activity in MKs across the 82 kb recombination interval containing the association signal. The x-axis represents the physical position on chromosome 8. The dark vertical line indicates the position of rs6993770. The nearby light vertical lines indicate the locations of seven variants in high LD (r2 > 0.9) with rs6993770. The y-axis of each panel corresponds to the sequencing read depth of an epigenetic assay. From top to bottom the panels correspond to ATAC-seq (open chromatin), H3K27ac (a mark of active enhancers) and H3K4me3 (a mark of accessibility to transcription factors). The blue rectangles at the bottom of the figure indicate enhancer regions in MKs inferred from a set of six histone modifications (H3K4me1, H3K4me3, H3K9me3, H3K27ac, H3K27me3 and H3K36me3) using the IDEAS chromatin segmentation algorithm106,107. The green rectangle indicates the position of exon 4 of ZFPM2. Panels c-d are adapted with permission from Ulirsch, J. C. et al. Interrogation of human hematopoiesis at single-cell and single-variant resolution. Nat. Genet. 51, 683–693 (2019), Springer Nature29.

