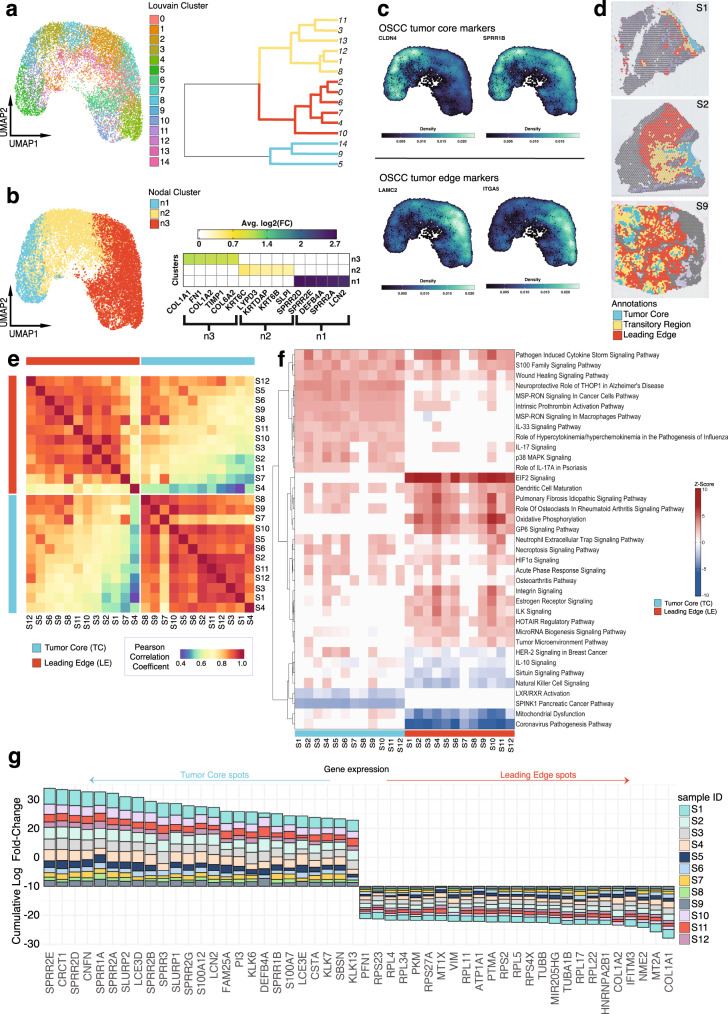
Fig. 2. TC and LE are spatially unique regions in the OSCC microenvironment.
a UMAP projection of 13950 malignant spots aggregated from all 12 spatially-profiled samples, partitioned by Louvain clusters with an accompanying phylogenetic tree demonstrating cluster transcriptomic similarity. b UMAP projection of 13950 malignant spots aggregated from all 12 spatially-profiled samples partitioned by three major nodal clusters, with an accompanying heatmap visualizing the log2(FC) of the top 5 DEGs for each cluster. c Nebulosa kernel density plot visualizing gene expression of literature-validated OSCC tumor core and leading edge markers. d TC transitory, and LE annotations for samples 1, 2, and 9. e Whole transcriptome Pearson correlation heatmap of TC and LE annotations across all spatially-profiled samples. Samples are ordered based on transcriptomic similarity. f Ingenuity Pathway Analysis heatmap visualizing predicted activation and deactivation of TC and LE pathways. Pathways are displayed if they are activated or deactivated across 10 or more samples and ordered based on similarity of z-score for each pathway across samples. g Consensus plot displaying the cumulative average logFC for the top 25 genes significantly differentially expressed between the TC and LE across more than 9 samples (adj. p < 0.001, two-sided Wilcox rank sum test, Bonferroni correction). Source data are provided as a Source Data file where relevant. UMAP uniform manifold approximation projection, OSCC oral squamous cell carcinoma.

