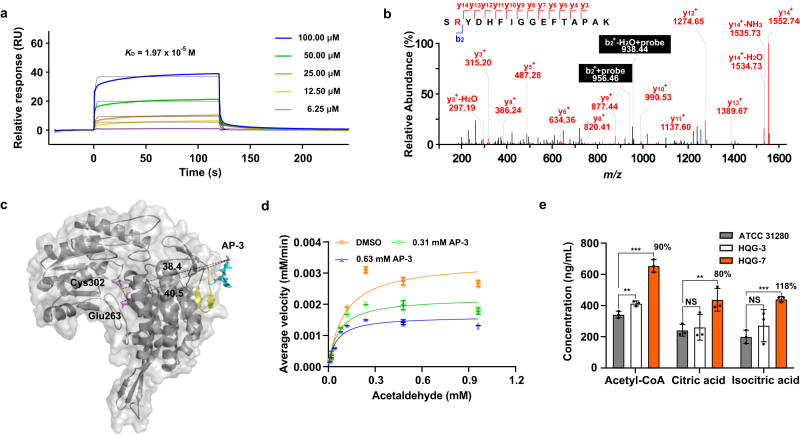
Fig. 5. Interaction between AP-3 and ALDH involved in central carbon metabolism.
a Interaction between AP-3 and ALDH was detected by SPR, with a KD value of 1.97 × 10⁻⁵ M. b MS2 spectrum of a QG-YNE-modified peptide from ALDH (18-SRYDHFIGGEFTAPAK-33 (Arg19 + 712.31 Da)). c Overall view of the AP-3 and ALDH homo-monomer complex. The distances (Å) between the conserved amino acids and AP-3 are indicated by dashed lines. Light grey, dTGD homo-monomer interacting with AP-3; sky blue, AP-3; yellow, peptide labeled by QG-YNE; orange, amino acid modified by QG-YNE; violet, conserved amino acids of ALDH. d Inhibitory kinetics of AP-3 with ALDH are displayed by double reciprocal plots obtained using 0.31 or 0.63 mM AP-3 or 1% (v/v) DMSO (the control). Data are presented as mean values with error bars representing S.D. from three independent experiments. e Intracellular acetyl-CoA, citric acid and isocitric acid concentrations from strains ATCC 31280, HQG-3 or HQG-7 by quantitative analysis. The discrepancy is shown as percentage numbers. *P < 0.1; **P < 0.05; ***P < 0.01.

