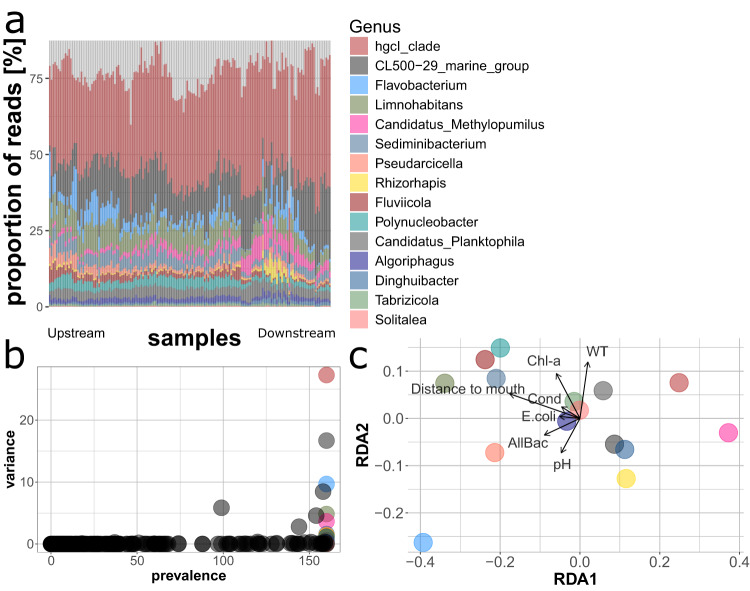
Fig. 2. Visualization of the analysis on the prevalence and variance for the most relevant bacterial genera for the Danube River.
a Dynamics of the genera among all the sampling sites. Samples are arranged from left (upstream) to right (downstream), with increasing distance from the source. b Bacterial genera with highest prevalence among the sampling sites and highest variance; the 15 colored dots are the taxa most suitable as biological indicators (highlighted in the ellipses) given their broad presence and wide variance across different environments. c The RDA shows the relationships of each of the 15 identified genera with the environmental drivers. This provides the basis to link the dynamics of individual genera with environmental properties; i.e., Canditatus Methylopumilus contribute more to the community at the river mouth while Limnohabitans at the source and Flavobacterium spp. increase in relative abundance with pH. Similar analyses on bacterial classes and families are presented in Supplementary Figs. 4 and 5.

