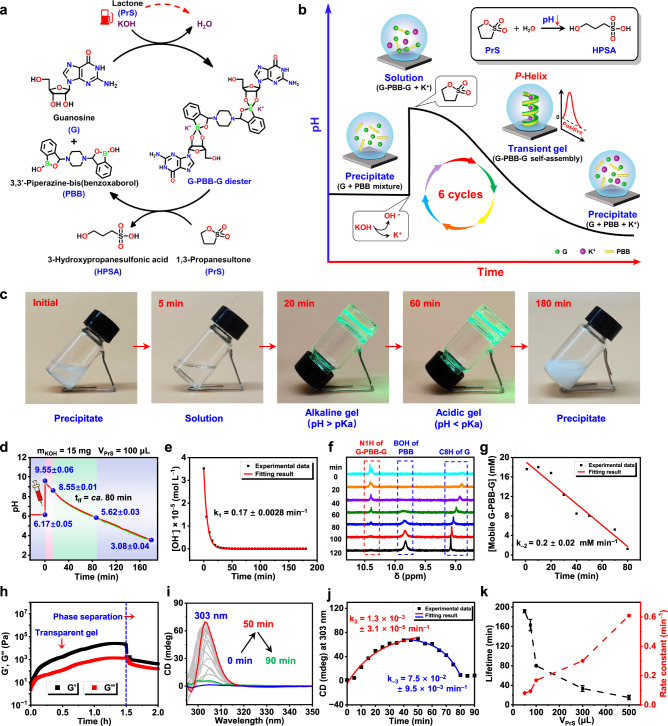
Fig. 4. Transient control over the supramolecular chirality and self-assembly kinetics.
a Schematic illustration of the chemical reaction network fueled with KOH and PrS. b Cartoon representing pH evolution profile for the temporal programming of the self-assemblies. c Phase transition of G and PBB mixture after cycle initiation (Supplementary Movie 2). d pH–time profiles after cycle initiation, three samples were tested in parallel. e The concentration of OH− against time during the hydrolysis of PrS. The measured pH is converted to [OH−]. f Time-evolved 1H NMR spectra after cycle initiation. g Curve of concentration of mobile G-PBB-G versus time. h, i Time-dependent rheological moduli profiles (h) and CD spectra (i) after cycle initiation. j CD signal at 303 nm versus time. k The plot of rate constant of PrS hydrolysis and lifetime of the transient hydrogels against PrS concentrations.

