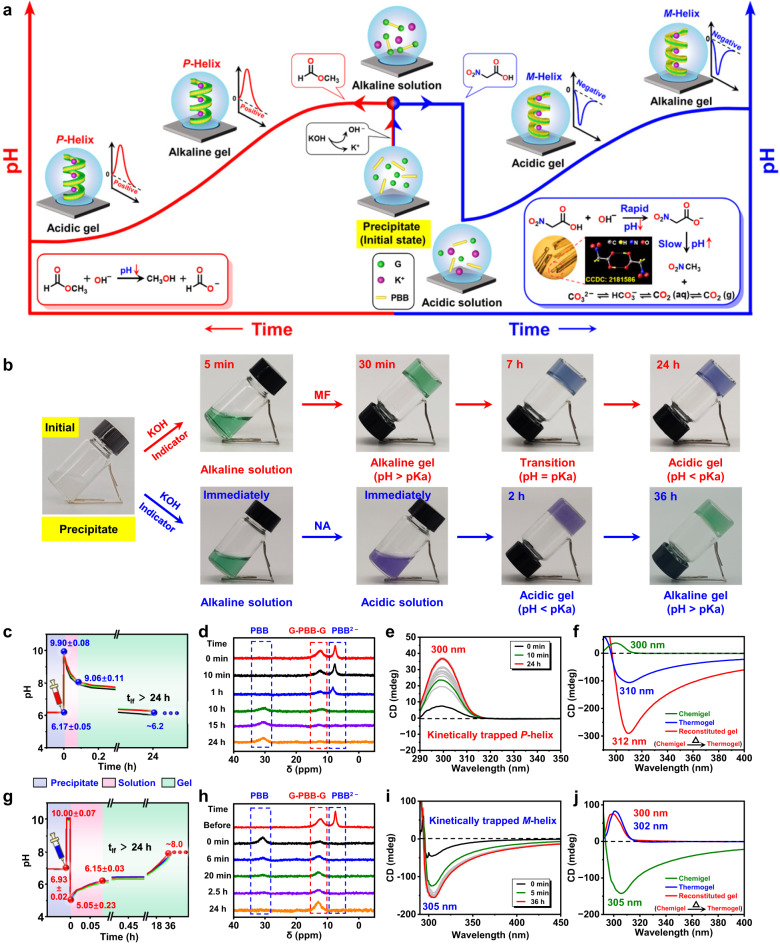
Fig. 5. Kinetically trapped supramolecular chiral inversion.
a Cartoon representing pH evolution profile for kinetically trapped programming of the self-assemblies. Left: KOH and MF system; Right: KOH and NA system. Inset: The POM image and single-crystal structure of NA. b Phase behaviors of G and PBB mixture after cycle initiation (Supplementary Movies 3 and 4). Methylene blue and neutral red (1:1) are used as a mixed indicator for monitoring pH changes (color change point: pH 7.0). c–e pH–time profiles (c), time-dependent 11B NMR spectra (d), and CD spectroscopy (e) after cycle initiation fueled with KOH and MF. f CD spectra of the as-prepared acidic chemigel, corresponding thermogel, and thermally annealed chemigel. g–i pH–time profiles (g), time-dependent 11B NMR spectra (h), and CD spectroscopy (i) after cycle initiation fueled with KOH and NA. j CD spectra of the as-prepared alkaline chemigel, corresponding thermogel, and thermally annealed chemigel.

