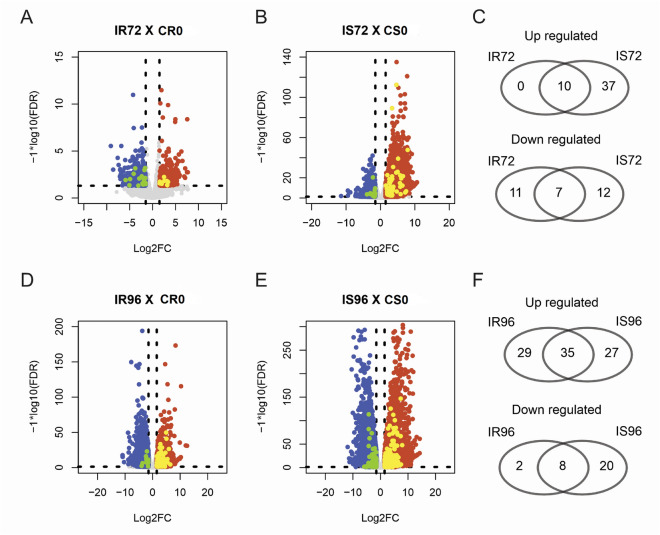
Figure 6.
Analysis of LRR-RLK genes of Phaseolus vulgaris involved in the response of resistant (Puebla 152) and susceptible (Jaguar) lines to race 73 of Colletotrichum lindemuthianum at 72 and 96 h after inoculation (hpi) compared with the time control 0 hpi. IR72 represents the resistant line inoculated at 72 hpi. IR96 represents the resistant line inoculated at 96 hpi. CRO represents the control resistant line inoculated at 0 hpi. IS72 represents the susceptible line inoculated at 72 hpi. 1S96 represents the susceptible line inoculated at 96 hpi. CS0 represents the control susceptible line at 0 hpi. The volcano plots were created using the R statistical environment and the Venn diagrams were created using the website https://bioinformatics.psb.ugent.be/webtools/Venn/.

