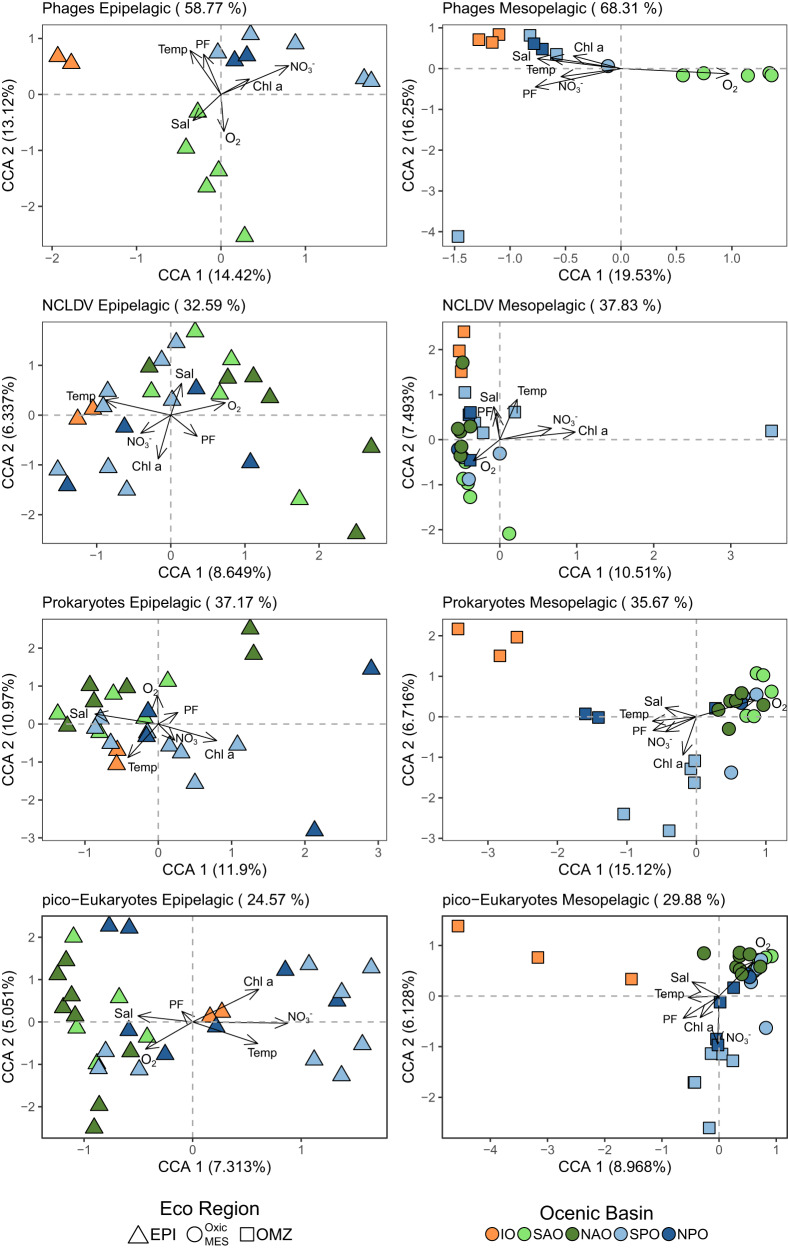
Fig. 2. Ordination plot of canonical correspondence analysis (CCA) from epipelagic (left) and mesopelagic (right) communities based on OTU composition.
Percentages in parentheses are the amount of variation constrained - in titles represent the total in each analysis, and in the axis represent the correspondent value for each dimension. Arrows represent environmental quantitative explanatory variables with arrowheads indicating their direction of increase. Shapes represent sampling sites. Shape formats represent eco-regions, epi epipelagic, Oxic MES oxic mesopelagic, OMZ oxygen minimum zone mesopelagic. IO Indian Ocean, NAO North Atlantic Ocean, NPO North Pacific Ocean, SAO South Atlantic Ocean, SPO South Pacific Ocean.

