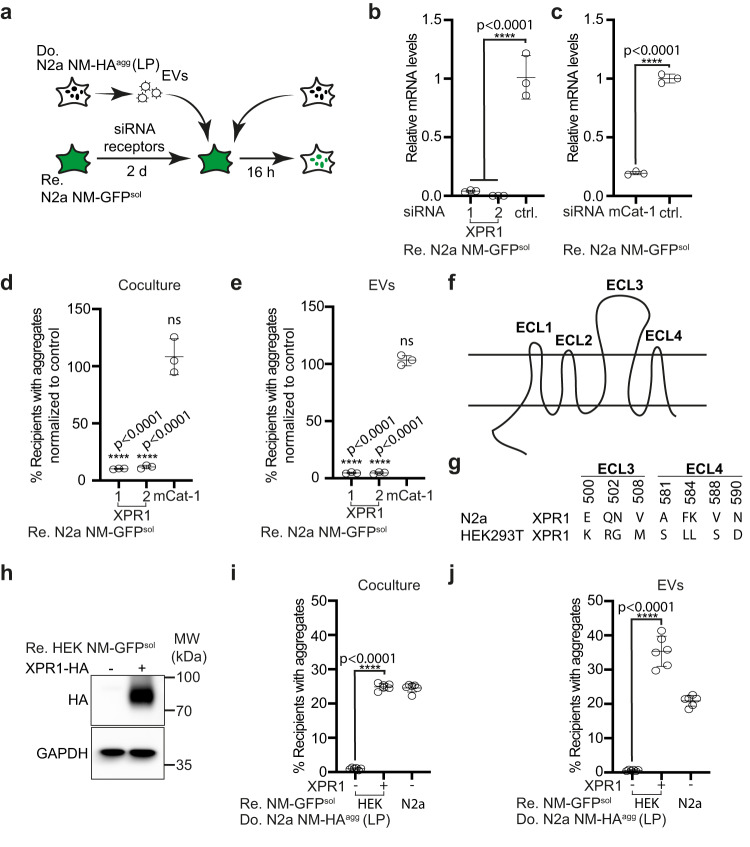
Fig. 5. Receptor polymorphisms modulate intercellular proteopathic seed spreading.
a Experimental workflow. Recipient N2a NM-GFPsol cells were transfected with two siRNAs against XPR1, one mCat-1 siRNA, or a non-silencing siRNA control. 48 h later, recipient cells were cocultured with donor cells (LP). Alternatively, recipients were exposed to EVs isolated from conditioned medium of N2a NM-HAagg cells (LP). NM-GFP aggregate induction was determined 16 h post-exposure or coculture. b Knock-down of XPR1 mRNA by two independent siRNAs was assessed 48 h post-siRNA transfection by qRT-PCR. Shown is the fold change of mRNA expression normalized to control (ctrl.). c Knock-down of mCat-1 mRNA. d, e Recipients with NM-GFP aggregates following receptor knock-down. Shown are the results of coculture (d) and of recipients exposed to donor-derived EVs (LP) (e). NM-GFP aggregate induction was measured 16 h post EV addition or coculture. f Transmembrane structure of XPR1. The receptor contains four extracellular loops (ECL1–4)84. g Polymorphic variants of xenotropic and polytropic X/P-MLV receptor XPR1 in mouse N2a and human HEK cells. Shown are mismatches in the surface-exposed loops ECL 3 and 4. ECL 3 and 4 are required for the binding of X/P-MLV84. h Ectopic expression of the N2a XPR1 receptor variant in poorly permissive HEK NM-GFPsol cells. Ectopically expressed XPR1-HA was detected using anti-HA antibodies. GAPDH served as a loading control on the same blot. i HEK NM-GFPsol cells were transfected with mouse XPR1-HA or mock-transfected and subsequently cocultured with donor N2a NM-HAagg cells (LP). N2a NM-GFPsol cells served as recipient controls. j Alternatively, transfected HEK NM-GFPsol cells were exposed to EVs from N2a NM-HAagg cells (LP). N2a NM-GFPsol cells served as recipient controls. All data are shown as the means ± SD from three (b–e) or six (i, j) replicate cell cultures. Three (b–e, i, j) independent experiments were carried out with similar results. P-values calculated by two-tailed unpaired Student’s t-test (c), one-way ANOVA with Dunnett’s post hoc test (b, d, e), or one-way ANOVA with Bonferroni multiple comparisons (i, j). Source data are provided as a Source Data file.

