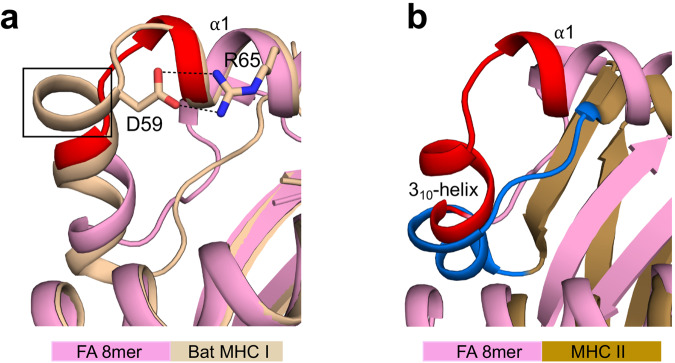
Fig. 6. Comparisons with the structures of bat MHC I and human MHC II molecules.
a Superimposition of FA 8mer and bat MHC I molecule (Ptal-N*01:01; PDB accession number 6J2D) structures. The bat molecule has an additional turn (highlighted by a black box) in the extended region of Gln54 to Tyr59 (highlighted in red) that we identified as disordered (see Fig. 2). In this turn, Asp69 forms salt bridge interactions (black dashed lines) with Arg65 of the α1-helix. b Superimposition of FA 8mer and human MHC II molecule (HLA-DR1; PDB accession number 1DLH) structures showing that the HLA-DM susceptible region, i.e., 310-helix and unstructured loop (highlighted in dark blue) overlaps with the 310-helix and extended region (highlighted in red) that we identified as critical in shaping the A and B pockets (see Fig. 4).

