
Fig. 3.
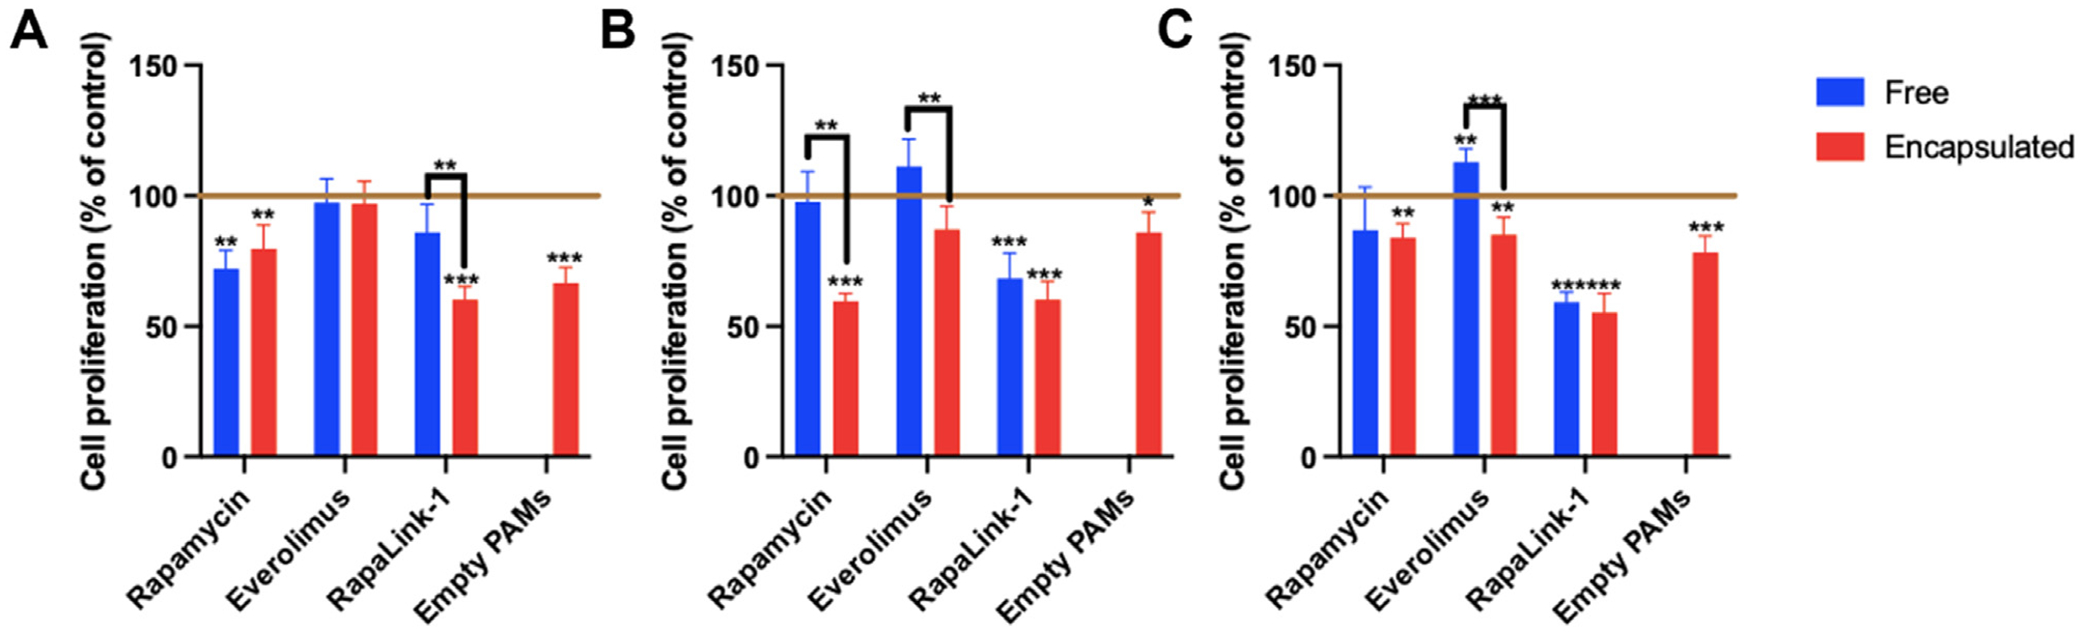
hCCD cell proliferation after 24 h incubation with mTOR inhibitors, either free or encapsulated in PAMs at (A) 50 μM, (B) 100 μM, or (C) 200 μM, as assessed by MTS assay (n = 6, * p < 0.05, ** p < 0.01, *** p < 0.001, comparing values to control with cell medium alone, indicated by horizontal line).