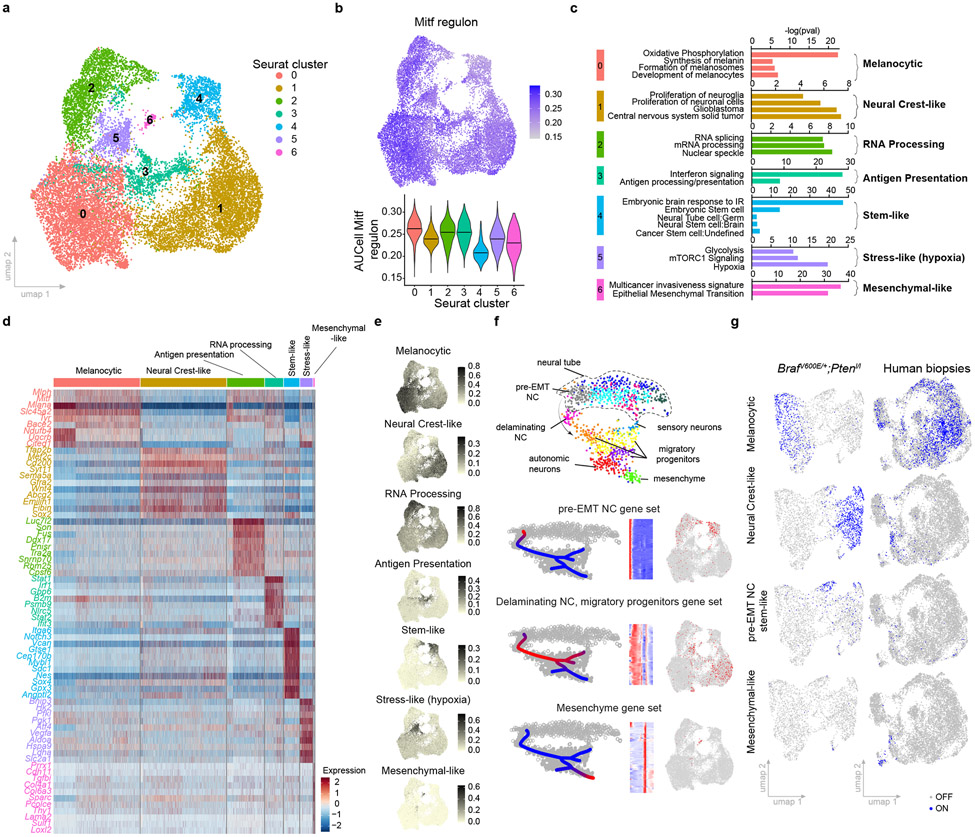
Fig. 1: Single-cell transcriptomic landscape of NRAS-driven melanoma.
a, Uniform Manifold Approximation and Projection (UMAP) of malignant cells analysed by scRNA-seq and integrated across five different NRASQ61K/°;Ink4a−/− primary lesions. b, Mitf regulon activity in mouse malignant cells projected as UMAP (upper panel) and violin plot (lower panel), respectively. The middle line represents the median. c. Functional enrichment terms of the characteristic Seurat clusters identified in a (Fisher exact test, two-tailed p value). d. Heatmap illustrating discriminative marker genes (n=9) for each functionally enriched state. e. AUCell score of top functionally enriched marker genes per state projected on malignant UMAP (see Supplementary Table 1). f, Mapping of gene expression program activities during murine neural crest development18 onto transcriptional states of NRASQ61K/°Ink4a−/− melanoma. g, Activity (binary AUCell score) of selected mouse malignant gene signatures from NRASQ61K/°;Ink4a−/− melanoma projected onto scRNAseq datasets from BRAFV600E;Ptenl/l mouse melanoma lesions (left panel) and human clinical Metastatic Melanoma samples22 (right panel).

