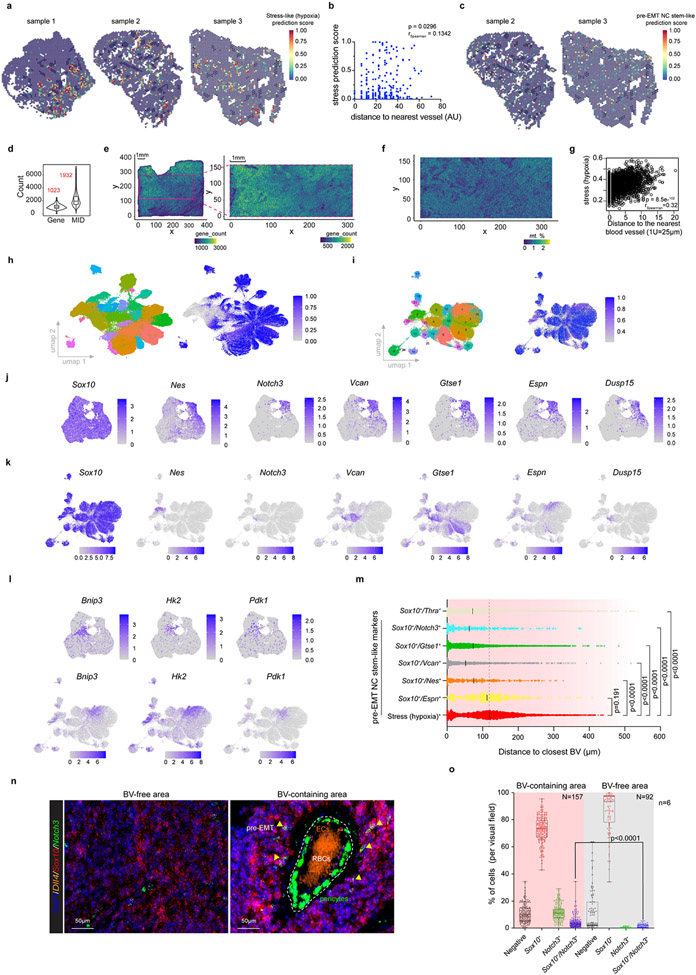
Extended Data Fig. 6: Spatially mapping melanoma heterogeneity.
a, Spatially resolved quantification of stress (hypoxia) state (prediction score) by label transfer of scRNA-seq data onto Visium spots (sample 1,2,3). b, Scatter plot shows a positive correlation (Spearman) between the stress (hypoxia) activity score and the distance to the nearest BV (Fisher exact test, two-tailed p value). c, Spatially resolved quantification of pre-EMT NC stem-like state (prediction score) by label transfer of scRNA-seq data onto Visium spots (sample 2,3). d, Violin plots and box plots showed the number of Stereo-seq detected genes (left) and Molecular Identifier (MID) (right) per bin50 (25 μm diameter). The middle horizontal line of the boxplot represents the median. e, Gene count visualization of Stereo-seq data. f, ROI colored by percentage of mitochondrial gene count (bin50). g, Scatter plot shows correlation (Spearman) of stress (hypoxia) activity (AUCell score) and distance to closest blood vessel per bin based on Stereo-seq bin50 data (Fisher exact test, two-tailed p value). h, UMAP of all segmented cells (170k) from molecular cartography (see Fig. 3f), coloured by Seurat cluster and melanoma (melanocytic state) gene signature activity (AUCell score). i, UMAP of malignant subset (109k) from molecular cartography, coloured by Seurat cluster and melanoma (melanocytic state) gene signature activity (AUCell score). j, Expression of pre-EMT NC stem-like cell markers assessed by scRNA-seq. k, Expression of pre-EMT NC stem-like cell markers assessed by Molecular Cartography. l, Expression of stress (hypoxia) cell markers as assessed by scRNA-seq (upper panels) and Molecular Cartography (lower panels). m, Horizontal histogram showing median distance (black line) to the nearest blood Vessel (BV) for all cells annotated as stress-hypoxia or expressing Sox10 and one of the indicated pre-EMT NC stem-like markers. Exact p values are indicated. n, Representative confocal image showing mRNA expression of the indicated genes, as detected by RNAscope, in blood vessel (BV) free and containing areas. Yellow arrowheads indicate the presence of cells positive for both Sox10 (red) and Notch3 (green). Endothelial Cells (Dll4+) are highlighted in orange. RBCs, Red Blood Cells. o, Quantification of m (n=6; p<0.0001). Boxes extend from the 25th to 75th percentile. The middle line represents the median. Whiskers represent min to max values. In panels m and o significance was assessed by an unpaired nonparametric, two-tailed Mann-Whitney Test (approximate p value, p<0.0001).

