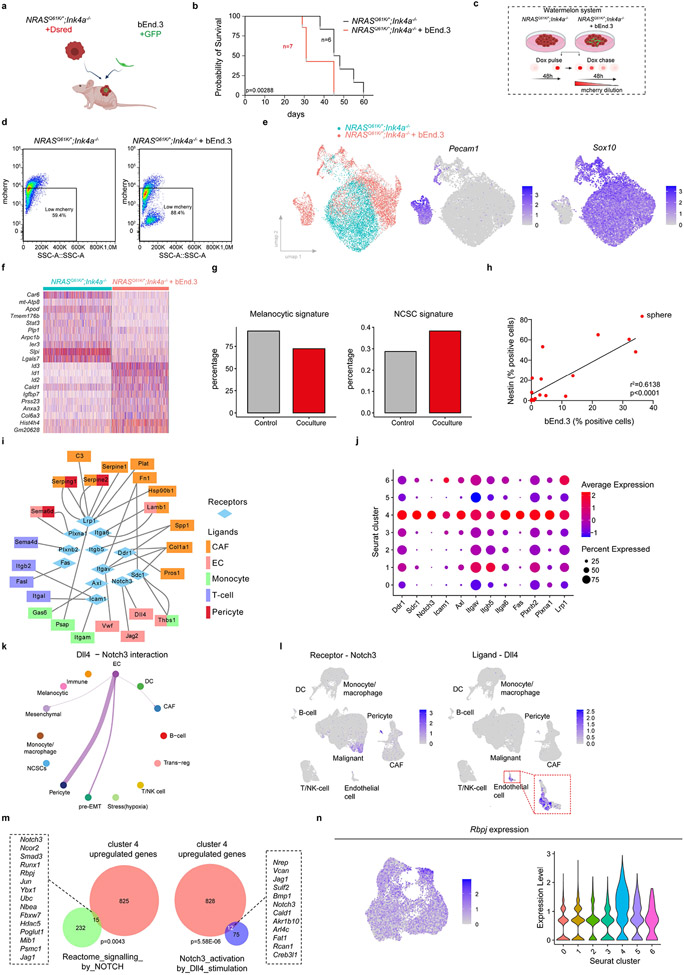
Extended Data Fig. 8: Melanoma-Endothelial cell heterotypic interaction promotes growth and induction of the pre-EMT NC stem-like phenotype.
a, Schematic representation of Fig. 3i. b, Kaplan-Meier survival curves from log-rank (Mantel-Cox) test of mice described in a (p=0.00288, n is indicated in the graph). c, Schematic representation of in vitro assays using the Watermelon system. d, Representative FACS profiles from Fig. 3j and experiment described in c. Percentages of low mcherry (mNeon-positive) populations. e, NRASQ61K/°;Ink4a−/− cells cultured either alone or in the presence of Bend3 cells for 48h and processed for scRNA-seq. Left, UMAP by sample identity; middle, expression of the endothelial cell marker Pecam1; and right, panmelanoma marker Sox10. f, Heatmap showing the overall transcriptional reprogramming effect observed following exposure of NRASQ61K/°;Ink4a−/− melanoma cells to Bend3 endothelial cells. g, Percentage of melanoma cells positive for the melanocytic and Neural Crest-like signatures (binary AUCell score). h, Melanospheres of NRASQ61K/°;Ink4a−/− cells grown in the presence of GFP-labeled Bend3 ECs for 10 days and the percentage of Nestin-positive cells was correlated with the amount of Bend3/GFP-positive cells. Linear regression test was used for statistical significance (n=19). i, Predicted cell-to-cell interactions based on known ligand-receptor pairs between TME populations (ligands) and the pre-EMT NC stem-like malignant cells (receptors) in scRNA seq data from mouse tumors as inferred by NicheNet. j, Dotplot showing gene expression intensities of selected receptors over the different Seurat clusters. k, Circos plot illustrating Dll4-Notch3 predicted interaction between cell types in scRNA seq data from mouse tumors and inferred by CellChat. The edge width is proportional to the prediction score. Note the predicted interaction of pre-EMT NC stem-like state with ECs. l, UMAP highlighting the specific expression of the ligand Dll4 in ECs and the receptor Notch3 in subpopulation of malignant cells. m, Left panel shows venn diagram highlighting the overlap of the pre-EMT NC stem-like cell state (cluster 4) upregulated genes with NOTCH signalling signature (Reactome). Right panel shows venn diagram highlighting the significant overlap of the pre-EMT NC stem-like cell state (cluster 4) upregulated genes with a Notch3 activation signature31. Hypergeometric distribution test was used for statistical analysis. P values are indicated in each Venn diagram. n, Rbpj expression in the malignant cluster of scRNA data from NRASQ61K/°;Ink4a−/− lesions projected either as UMAP (left panel) or as violin plot (right panel) for each malignant transcriptional state. Schematic in a and c made with Biorender.com.

