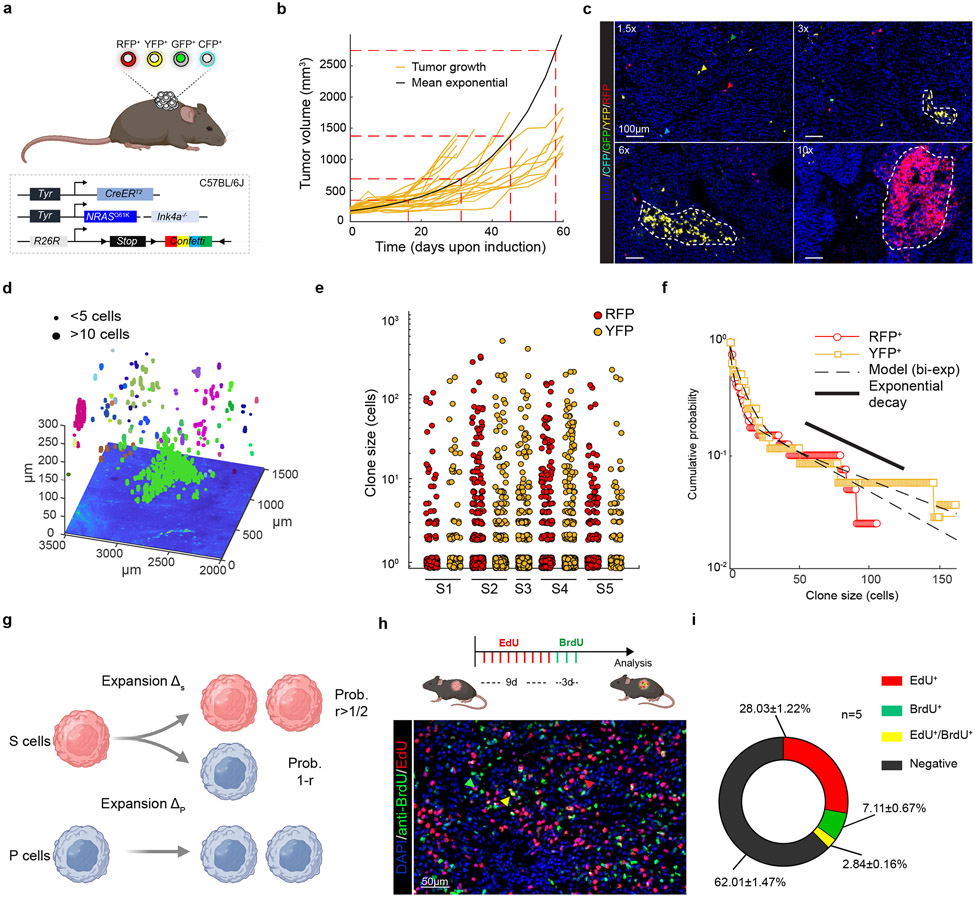
Figure 2: Multicolour lineage tracing reveals that melanoma growth is hierarchically organized.
a, Schematic representation of mouse model. b, Tumour growth kinetics (mm3) of individual tumours (yellow), and corrected mean obtained from extrapolating the missing time-points using the model prediction (black curve). c, Confocal images of melanomas exhibiting Confetti expression at different relative growths upon TAM administration (0.5 mg). Representative images from at least 8 mice per group. d, Representative reconstruction of 3D clones. Independent clones appear in different colours. A single z-slice of the corresponding dataset is shown at the bottom of the plot. e. Dot plot showing the distribution of clone sizes, by sample and by channel obtained from 5 cleared tumours (see Supplementary Table 5). f. Cumulative distribution, showing the probability of observing a clone larger than a given size. The corresponding bi-exponential fits (dashed line, R2=0.96, standard error of the fit S=0.03) and exponential decay of the tail (black line) are shown. g, Schematics of the minimal hierarchical model. The parameters ΔS and ΔP correspond to the expansion rates of the S and P populations, respectively. Although the data could accommodate a “line” of fit parameters, fixing the relative transition rate of stem cells into the progenitor cell compartment, r=0.75, the model shows an excellent fit to the data with ΔS~0.09 and ΔP~0.04 and a stem fraction fS~0.21 or 21% (see Supplementary Note). h, Upper panel, experimental procedure for dual pulse labelling assay using EdU and BrdU. Lower panel, image of a double BrdU (green) and EdU (red) immunostaining. Representative image from n=5 tumors. i, Pie-chart illustrating the percentage of single and double labelled cells. Quantification was assessed from 5 different mice and 4 technical replicates per mouse. Schematic in a, g and h made with Biorender.com.

